Al Jazeera Analyzed 6,500 Homepage Images. Here’s What They Learned

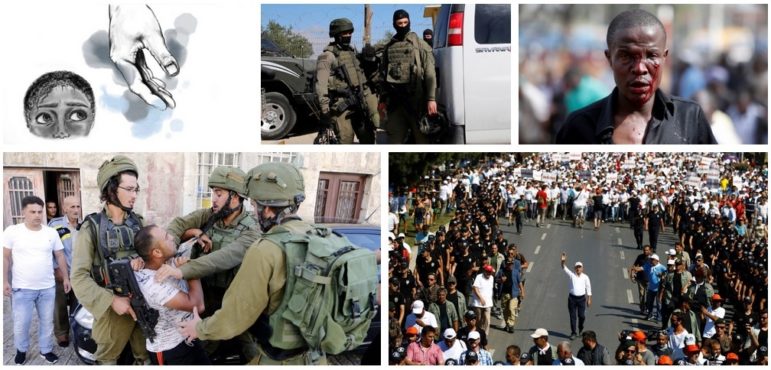
Picture Perfect: AJ Labs’ collage of the images its journalists used in news articles in 2017.
Choosing the right image to tell your story is just as important as a good news headline. As 2017 came to a close we decided to collect all the images that we published on our homepage throughout the year and ask ourselves what types of images did our readers see when they came to our website?
Asking the Right Questions
To analyze both the contents and context of each image, we used Google’s Vision API. This powerful machine-learning model uses Google’s massive database of images to detect faces, landmarks and everyday objects within an image. It works by letting you upload any image to its service and returns an image’s characteristics in the form of a weighted score.
Uploading an image of US President Donald Trump returns:
 To capitalize on this technology there were two main factors that we took into consideration:
What would we want to learn from our 6,500 images?
How can visual machine-learning techniques such as this one be used in the newsroom?
We started our exploration by asking ourselves the following questions:
- Which president or public figure appeared the most in our images in 2017?
- How many times did we use people’s faces and who were they?
- How many photos were of women and how many of men?
- How many times did we use photos of protesters?
- How often did we reuse the same photograph for another story?
- How many times did we use maps as our main image?
- What everyday items appeared most in our images?
Of course, we weren’t sure how accurate or granular Google’s Vision API was in analyzing our dataset, so we started with a small sample of images and kept working our way up until we ended up querying and intersecting more than 25,000 records of data.
Technicalities
We used Python for scripting and querying the data and MySQL for storing and sorting the data.
It took around eight hours to run the script and another four hours to perform the SQL queries and analysis.
Preliminary Findings
While Google’s Vision API is regarded as one of the most advanced image detection platforms, it has its shortcomings. As expected, it doesn’t always correctly identify the objects within the frame. In some cases this margin of error is quite acceptable but in others it totally misses the mark.
Knowing this, here are some factors worth considering when using Google’s Vision API:
- The most useful property for analyzing news images was definitely the “web entities” feature. Web entities returns a weighted keyword list as well as contextual links to stories containing the image. This was often very accurate for detecting well-known people.
- In cases where people were less known, combining the “web entities” and “label entities” yielded better results.
- Photos with groups of people didn’t perform very well. In several instances, a large group of refugees in boats wearing life jackets were often mislabeled as “fun” with a high level of certainty.
- Sometimes important elements in a photo were neglected. For example, a photo of fighters on top of a pickup truck in the desert only returned “vehicle” as a keyword.
- Hand-drawn images or illustrations performed very poorly.

Group Dynamics: Google’s Vision API didn’t perform that well with hand-drawn images or pictures of groups of people.
Answers to Our Questions
- Which president or public figure appeared the most in our images in 2017?
Trump, followed by Turkish President Recep Tayyip Erdogan and former US Secretary of State Rex Tillerson. We further drilled down to find the emotions on Trump’s face to be 20 percent joy, 0.6 percent anger, 3 percent sorrow, and 2 percent surprise. - How many times did we use people’s faces?
3,726 times - Did we use more photos of men or of women?
Unfortunately, we weren’t able to answer this. - How many times did we use photos of protesters?
414 times - How often did we reuse the same photograph for another story?
We reused 1,703 images during the past year for news stories. - How many times did we use maps as our main image?
143 times - What everyday items appeared most in our images?

The list of people who appeared 5 times or more:

Final Thoughts
Using image analysis tools on their own means nothing without asking the right questions. To yield any actionable results, these kinds of technologies should ideally be integrated into existing newsroom processes to provide value for both journalists and viewers.
The plan now is to experiment with the following integrations:
- Tagging photo repositories inside our CMS to make it easier for our journalists to find specific images very quickly. For example, find all images of Donald Trump next to Emmanuel Macron with a smile on his face.
- Help journalists find the best photo that matches the story. Or better yet, filter out all the images that should not go with the story.
- Utilize Google’s Cloud Video Intelligence to analyze the contents of live video and extract newsworthy content on the fly.
- Apply this technology to VR and 360 images where objects in a given scene can be detected.
We believe 2018 will push machine-learning forward and we are looking forward to developing its applications within the newsroom.
Those were our questions. If you were to analyse the same set of photos, what questions would you ask?

This post first appeared on AJ Labs’ Medium page and is cross-posted here with permission.

Reporter’s Guide to Investigating Cryptocurrency

Tipsheet on Partnering with Civil Society Organizations and Non-Governmental Organizations

AI Accountability Reporting Guide

Guide to Mapping Analysis Using QGIS
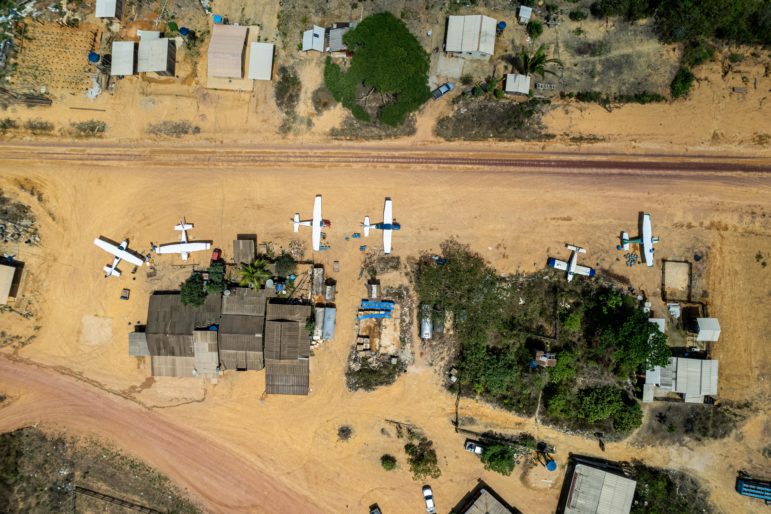
Investigating Rainforest Destruction: Finding Illegal Airstrips Using Machine Learning
Dollars for Data Journalism: How One Project Makes Money by Selling Data on Police
How They Did It: Building a Database of Police Use of Force in the US

How They Did It: Uncovering the Top 15 “Dark Money Groups” in US Politics

This work is licensed under a Creative Commons Attribution-NoDerivatives 4.0 International License
Republish our articles for free, online or in print, under a Creative Commons license.
Republish this article
This work is licensed under a Creative Commons Attribution-NoDerivatives 4.0 International License
Read Next
Case Studies Reporting Tools & Tips
Investigating Rainforest Destruction: Finding Illegal Airstrips Using Machine Learning
Rainforest Investigations Network fellow Hyury Potter used data reporting and machine learning to investigate the link between clandestine airstrips and illegal mining in the Brazilian Amazon during the past two years.
Case Studies
Dollars for Data Journalism: How One Project Makes Money by Selling Data on Police
After NJ Advance Media spent lots of time and money to find and clean up data for a police accountability project, it decided to sell this data, while still keeping its database free to the public. Reporter Stephen Stirling tells OpenNews’s Erika Owens how this works.
Case Studies
How They Did It: Building a Database of Police Use of Force in the US
After a landmark New Jersey supreme court ruling made police use-of-force reports fully available to the public, NJ Advance Media decided to dig in. They fought tooth and nail to get their hands on the reports and create the United States’ most comprehensive statewide database on this issue.
Case Studies
How They Did It: Uncovering the Top 15 “Dark Money Groups” in US Politics
Non-partisan advocacy organization Issue One spent a year combing through thousands of financial filings over a six-year period to figure out where the money for campaign advertisements in the USA was coming from and who it was going to. They ultimately compiled a database that outlined the top 15 “dark money groups” — organizations that receive millions of dollars of donations from companies and businesses to fund campaign ads.