
Inside a Pioneering Italian Data Journalism Collaboration
 Editor’s Note: Confiscati Bene, released in mid-December in Europe, is a pioneering data journalism collaboration that digs into the $4 billion of goods in the EU confiscated from criminals by European authorities. An international team of journalists and their allies sought to create a European database of seized assets and answer troubling questions about the accountability of the process. Confiscati Bene (literally, Well Confiscated) received support from GIJN member JournalismFund.eu; the main project can be seen at http://eu.confiscatibene.it.
In this post, Andrea Nelson Mauro, founder of project leader Dataninja.it (another GIJN member) tells us about organizing the project in Italy, which involved a diverse group of journalists, activists, and technologists. Mauro describes step-by-step the investigation — now published in 19 Italian newspapers and across Europe — and explains the various tools used, including web scraping, content curation, data mining, and coding. We expect more great projects from of this group.
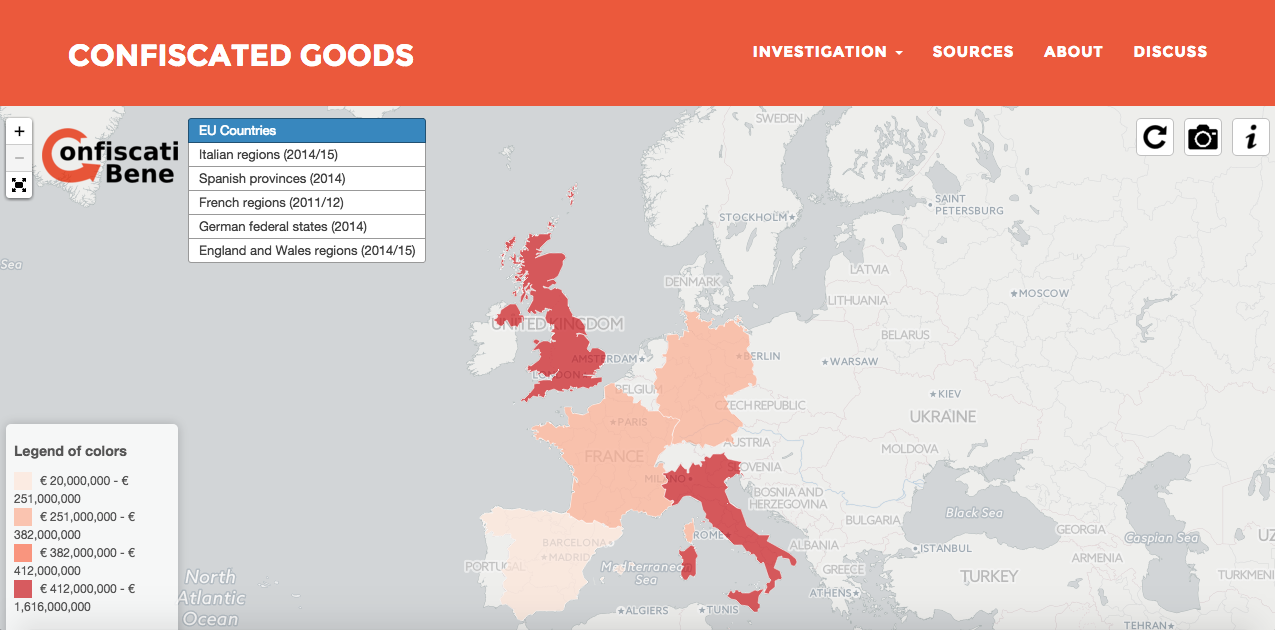
On September 5 we had a Publication Day in Italy for our investigation regarding goods confiscated from the Mafia: one national newspaper (L’Espresso) and 18 websites of the same publisher (Repubblica-L’Espresso) — see the map below — put online our series revealing how many buildings and companies have been seized, region by region, to whom they did belonged, and what the government is doing to give back these assets to Italian citizens. It was a big opportunity and an amazing experience for those of us working on the investigation. We began the project in July 2015.
Meanwhile, a very interesting blogpost by Alberto Cairo, the Knight Chair in Visual Journalism at the University of Miami, appeared on lthe NiemanLab website. Titled “Data Journalism Needs To Up Its Own Standards,” the story talked about over-promises from FiveThirtyEight and Vox.com projects that should “treat their data with more scientific rigor,” according to Cairo. For these and for other examples he cited, you may find — IMHO — a lot of interesting suggestions, expecially if you’re doing journalism with data, and the kind of issues and doubts we see every day in our jobs inside Dataninja’s pipeline. Until now data journalism — as I saw it — has developed too much as descriptive statistics, data visualizations, predictive analysis, and special effects on the web (the “Wow! Effect,” as some friends say— or “map-itis” about people who publish a map every minute without any news value).
So, I’d like to share what we did for the project “Confiscati Bene” (literally, “Well Confiscated”) with the aim of starting a dialogue and getting feedback on we did well and what we need to improve.
Step 1: From Meeting the Open Data Project “Confiscati Bene” to Working Inside
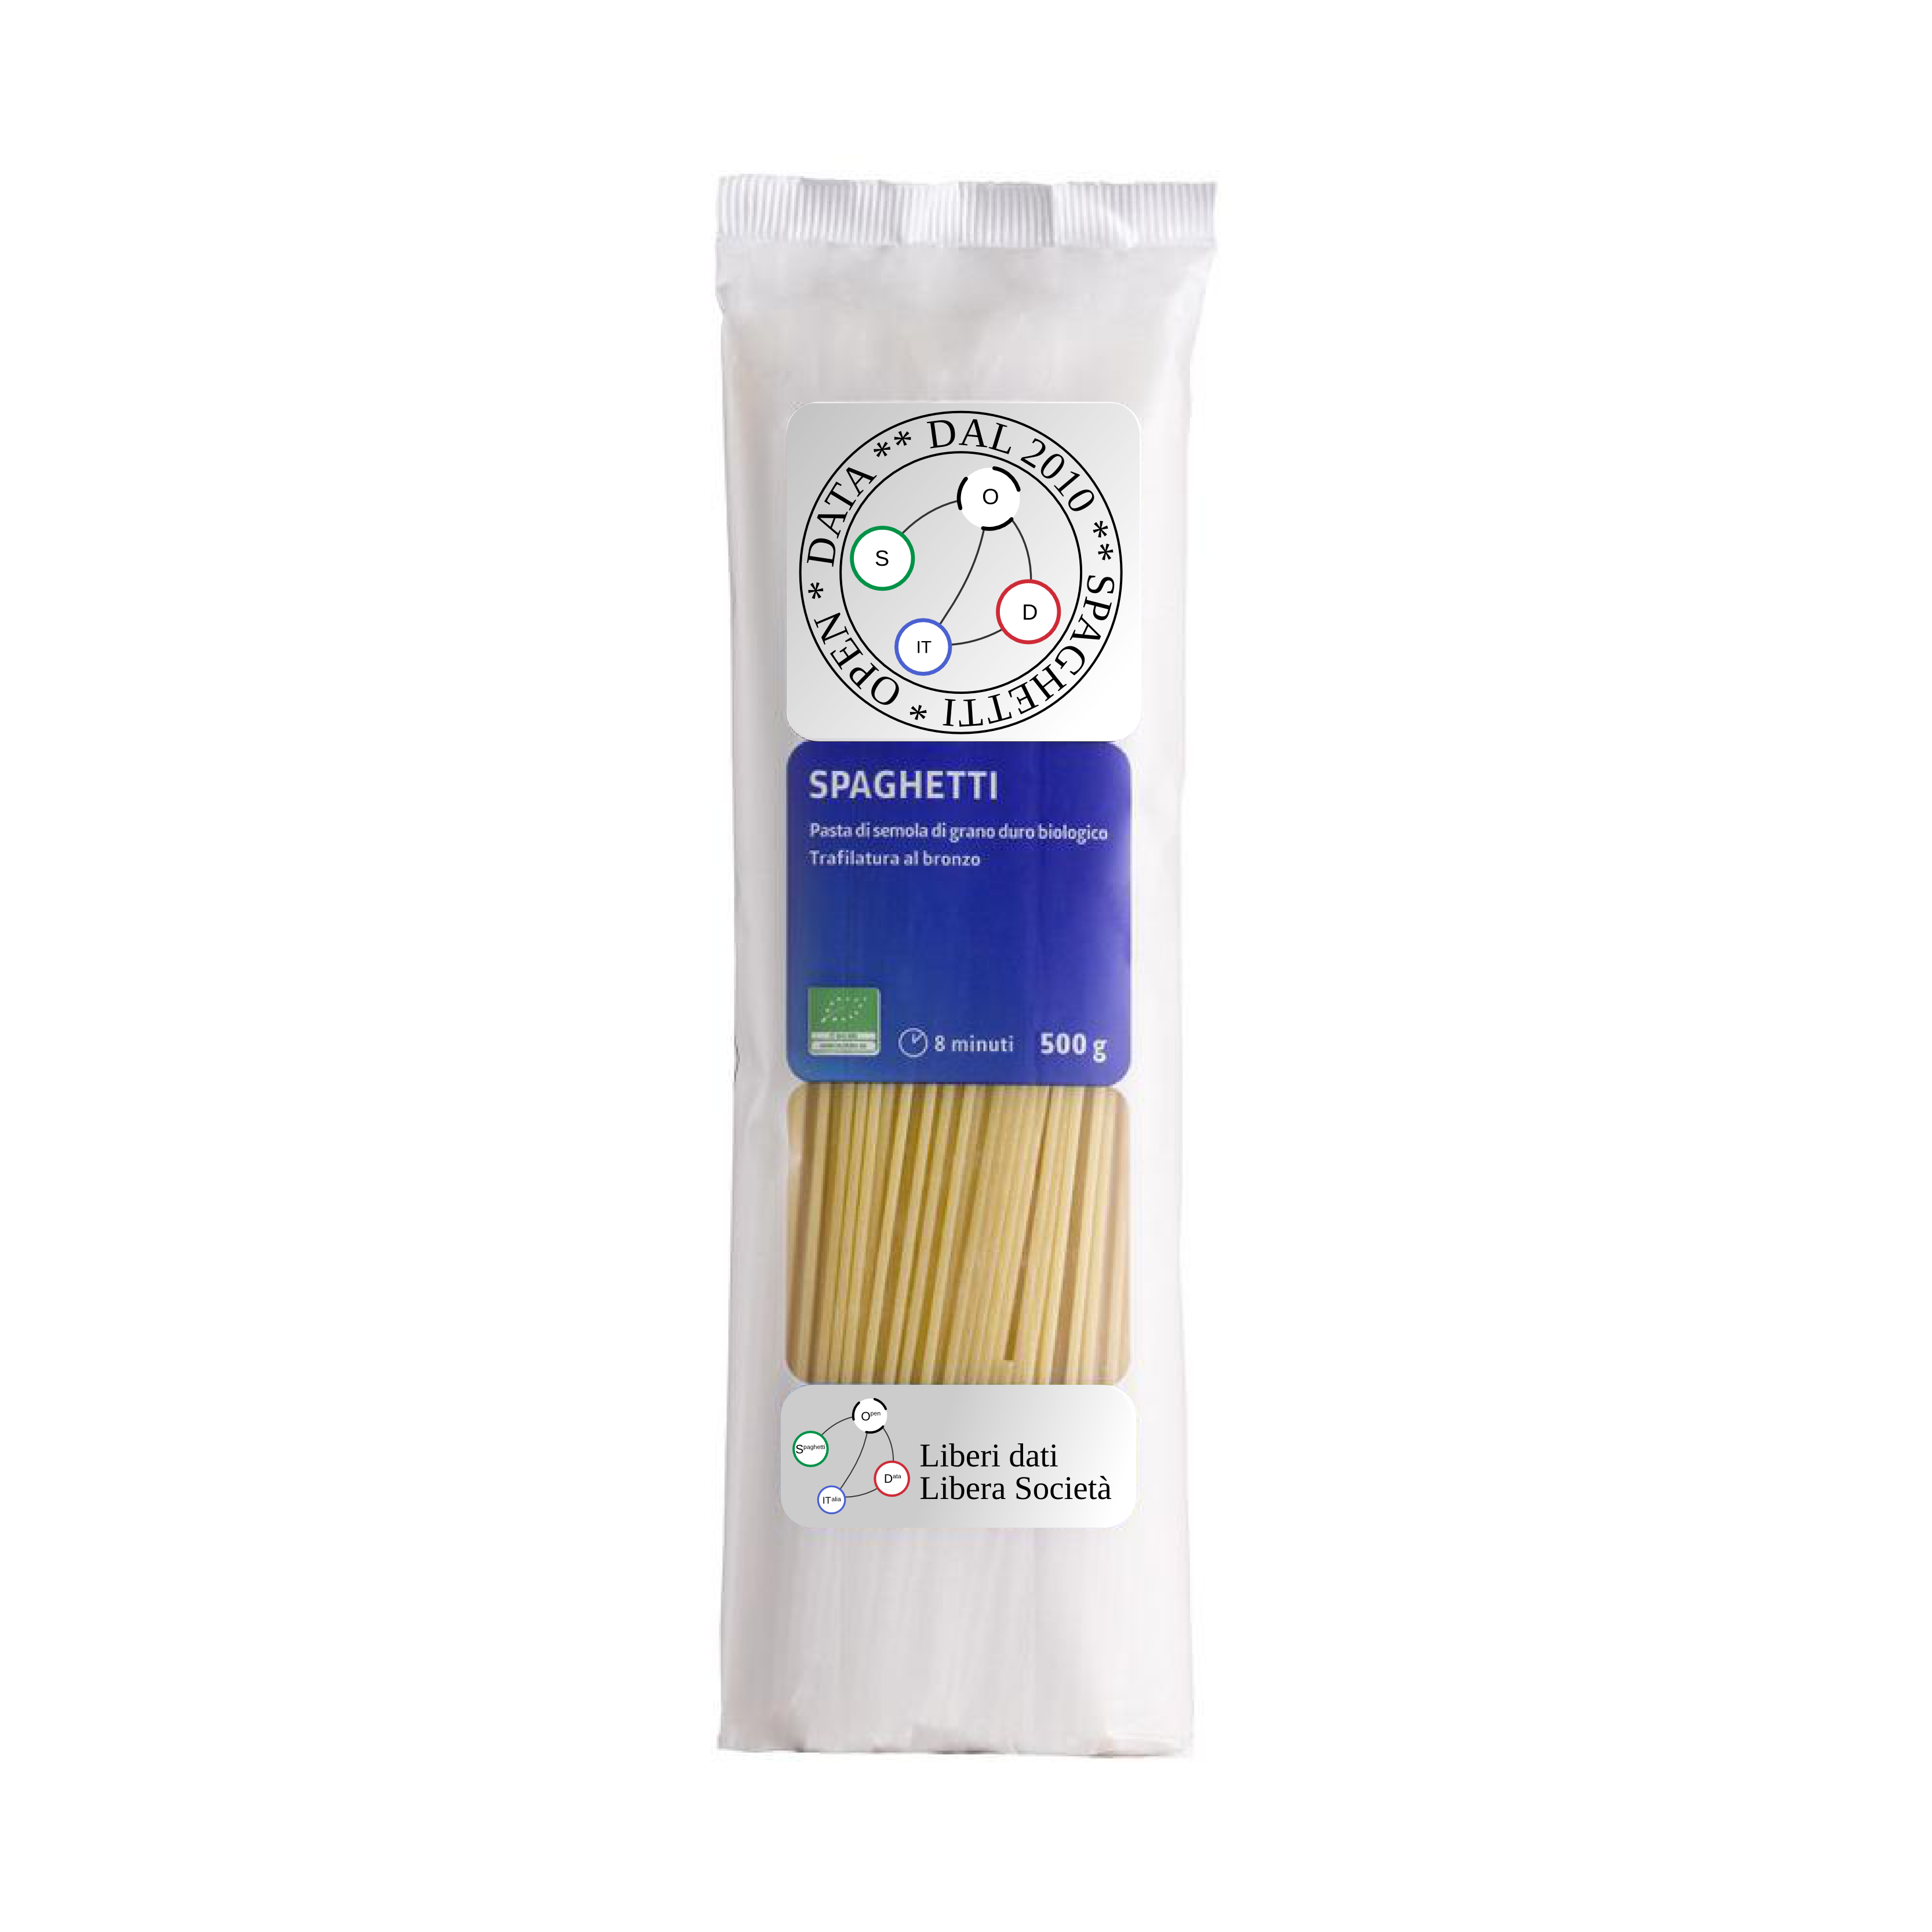
Spaghetti Open Data (SOD) is a group of Italian citizens interested in release of public data in an open format.
The open data world gave me a great opportunity for refactoring my skills, and some years back I joined Italy’s “Spaghetti Open Data” community. In March 2014, during a hackathon, we developed the first version of “Confiscati Bene,” an independent project powered by citizens to open data on goods seized from the Mafia. As first step, all data was scraped from the official website of the agency which has a database of confiscated goods. What a great opportunity! Not only for publishing the data, but for trying to improve the project with our journalistic and data skills. We joined the team and helped build an online platform with a data catalog on Mafia assets that needed to be updated. Working this way we learned a lot about confiscated goods (by reading Acts from Parliament and discovering various reports and documents); Team members shared these documents on a project mailing list. How long would I have spent finding these resources on my own, instead of having a team that shared it quickly? How much could people help us (as journalists) do our jobs better, if only we gave them the opportunity? Doing it together — and not only with journalists — should work better.
Step 2: From Starting the Investigation to Publishing in 19 Newspapers and on the Web
By the end of July we had started our investigation and built a team of three journalists (Andrea Nelson Mauro — that’s me! ?; Alessio Cimarelli; and Gianluca De Martino). We read something like 3,000 pages of documents and reports by various institutions and observatories, to better understand the data (even we are not experts in this area). By matching results and leads, we created a kind of “content curation” from the documents, extracting the most important journalistic issues (for us). For instance, we discovered that the Italian Government (with the EU) provided € 6 million to the public agency overseeing confiscated goods to build a big database to collect these data, but no one did anything, no one knows where the money went, and no one ever saw the project.
Regarding the skills and activities we developed:
- Data (and Story) Mining — This was a big chapter of the investigation: we did it on official documents and also on the web for finding matching results and statistics with data scraped from the public agency of confiscated goods. Sometimes you need to be determined to understand exactly at which step the good is taken. For example, is it seized, confiscated, frozen by the law, ceded to an NGO?
- Coding and Geo Issues — For showing confiscated goods on a map, we needed to develop a visualization tool. This was created by Alessio Cimarelli, using only open source tools (Leaflet, D3js, OSM Nominatim, and others). Data are showed on the Italian regions by absolute values and not normalized by population or other dimensions, because we aimed to draft a kind of raw overview: to show where the Mafia spent the money, and the differences between big cities and small towns.
- Content Curation — We thought every confiscation should be told by every newspaper, as well. Starting from this idea, we aggregated every story by region and from newspaper archives, and from the most important bosses from whom goods were confiscated. Working this way (and after matching results with quantitative data) we could draw an overview showing which mafia (the Sicilian Mafia, the Camorra, the Ndrangheta), showing a kind of distribution by region.
- The Review Process — Working in a team is very helpful for pointing out mistakes, but even better in my honest opinion was sharing articlel drafts with other members of the project.
Step 3: Looking Forward, We’re Doing Database Journalism
After we published, we gave the data back to Confiscati Bene, by uploading in a data catalog developed with DKAN (a Drupal CMS like CKAN, powered for us by Twinbit). We’re part of the team of this project, so we’re interested for improving it, collecting other data and developing other chapters (for instance across Europe). With release of the project in 19 newspapers, we’ve now successfully disseminated not only the news from the project but the data itself, and we’re continuing to update the data. I don’t know where we will end up, but I know we’re moving forward and trying to improve this, so maybe you will hear yet more about Confiscati Bene.

This post was originally published at DataNinja.it and is posted here with permission. Andrea Nelson Mauro is a data journalist and founder of Dataninja.it and Datamediahub.it, and is part of SpaghettiOpenData.org and OpenDataSicilia.it.

Reporter’s Guide to Investigating Cryptocurrency

Tipsheet on Partnering with Civil Society Organizations and Non-Governmental Organizations

AI Accountability Reporting Guide

Guide to Mapping Analysis Using QGIS
Data Journalism Top 10: Pegasus, Silencing Reporters, Europe Flooding, Diversity Mapping, K-pop
Data Journalism Top 10: Secret Tax Files, India’s Faltering Vaccines, Western Drought, Argentina’s News Deserts, The Gambia’s Toxic Water
Data Journalism Top 10: Tulsa Race Massacre, Canada’s Prison Bias, Colombia’s Police Violence, Football’s Big Money, Europe’s Lobbyists, Battling Misinformation

How a WhatsApp Community Is Bringing India’s Data Storytellers Together

This work is licensed under a Creative Commons Attribution-NoDerivatives 4.0 International License
Republish our articles for free, online or in print, under a Creative Commons license.
Republish this article
This work is licensed under a Creative Commons Attribution-NoDerivatives 4.0 International License
Read Next
Data Journalism
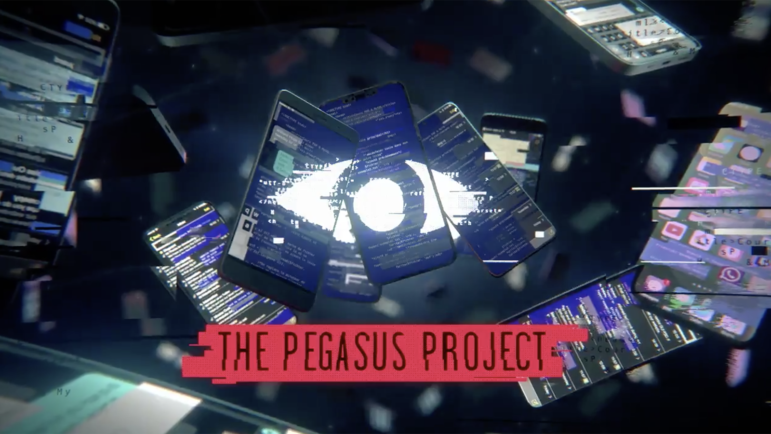
Data Journalism Top 10: Pegasus, Silencing Reporters, Europe Flooding, Diversity Mapping, K-pop
Our NodeXL mapping from July 12 to 18, which tracks the most popular data journalism stories on Twitter each week, found a series of articles resulting from the collaborative project that analyzed an unprecedented leak of more than 50,000 phone numbers selected for surveillance. In this edition, we also feature an insight into Facebook’s data wars by The New York Times, an interactive piece by Al Jazeera on how the holy city of Mecca has expanded, and a colorful project by the Washington Post on the rise of K-pop.
Data Journalism
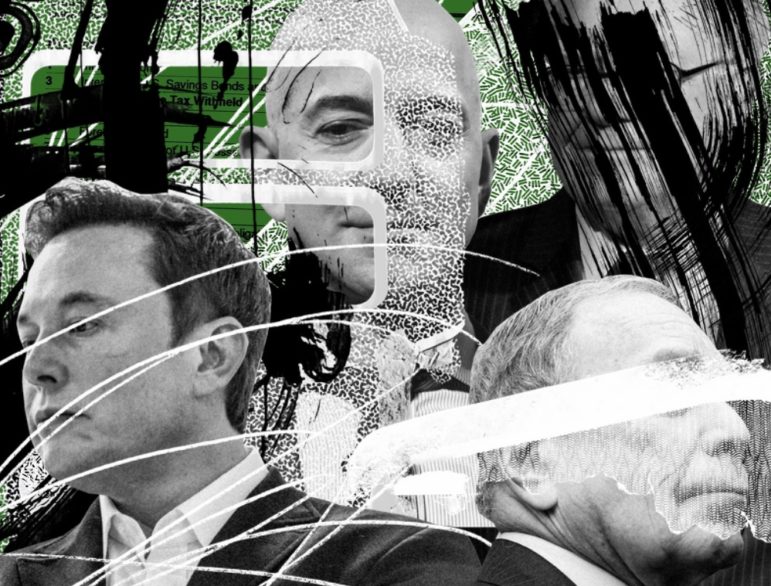
Data Journalism Top 10: Secret Tax Files, India’s Faltering Vaccines, Western Drought, Argentina’s News Deserts, The Gambia’s Toxic Water
Our NodeXL #ddj mapping from June 7 to 13, which tracks the most popular data journalism stories on Twitter each week, focused in on this major investigation by ProPublica, which offers an unprecedented look inside the financial lives of US billionaires. In this edition, we also feature a detailed look at India’s faltering vaccination campaign, a data project exploring Argentina’s news deserts, and an investigation of The Gambia’s water paradox.
Data Journalism
Data Journalism Top 10: Tulsa Race Massacre, Canada’s Prison Bias, Colombia’s Police Violence, Football’s Big Money, Europe’s Lobbyists, Battling Misinformation
For inmates in Canada, risk assessments can determine which type of prison they are sent to and their chances of successfully reentering society. But an investigation by The Globe and Mail revealed that these assessments are biased against Indigenous and Black inmates. Our NodeXL #ddj mapping from May 24 to 30 also found an interactive project by The New York Times recreating the Black neighborhood in Tulsa, Oklahoma destroyed in 1921, and data-driven reporting on the influence of big money in soccer, the cost of Italy’s vaccination campaign, and police violence during the recent protests in Colombia.
Data Journalism
How a WhatsApp Community Is Bringing India’s Data Storytellers Together
Recently, more than 400 people gathered in the Indian city of Bengaluru for VizChitra 2026, a conference on data visualization and storytelling — but that is only a small part of the story.