Lies & Statistics: Fudging Data in India’s Most Populous State


![]() Editor’s Note: “Interrogate your data!” That’s what the best data journalism trainers often tell us. Data need to be vetted and verified as closely as human sources — not something every reporter does in today’s rapid embrace of data journalism. Here’s a glaring example of why you need to be careful, brought to us from GIJN-member IndiaSpend, India’s dynamic (and first) nonprofit center for data journalism.
Editor’s Note: “Interrogate your data!” That’s what the best data journalism trainers often tell us. Data need to be vetted and verified as closely as human sources — not something every reporter does in today’s rapid embrace of data journalism. Here’s a glaring example of why you need to be careful, brought to us from GIJN-member IndiaSpend, India’s dynamic (and first) nonprofit center for data journalism.
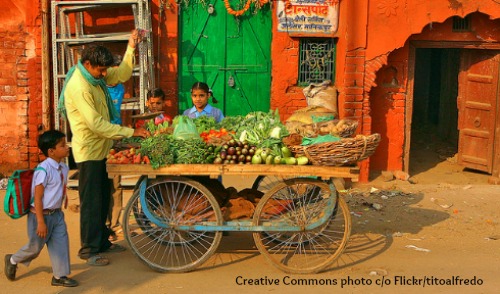
Is Uttar Pradesh (UP), India’s most populous state, better governed than richer and more advanced Maharashtra, Tamil Nadu, Karnataka, and Gujarat states?
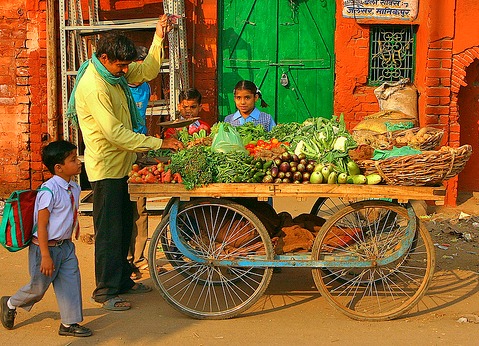
Agra market in Uttar Pradesh state (CC photo c/o flickr.com/titoalfredo)
If you look at some statistics, the answer is yes.
UP has a reputation for widespread misgovernance, but official data reveal lower disease outbreaks, lower crimes, and lower accidents than the other states we mentioned.
And so unfolds a story of lies, damned lies and statistics.
In a recent question in Parliament’s upper house, the Rajya Sabha, the government released data on outbreaks of epidemic diseases in 2014. The data relate to diseases, such as diarrhea, cholera, and malaria.
Maharashtra state comes off the worst across India, with 204 outbreaks of infectious diseases. Uttar Pradesh, which, with 199 million people, has a population 77% larger than Maharashtra, reported just 35 outbreaks.
States like Tamil Nadu and Karnataka with a population of 72 million and 61 million, respectively, saw many more disease outbreaks.
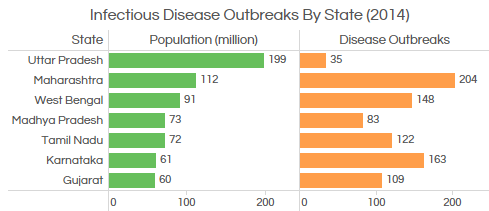
Source: Rajya Sabha
The information can be interpreted in two ways. The more apparent conclusion is that UP does a better job of controlling infectious diseases than most other large states.
However, the numbers do not add up.
On measures such as maternal and infant mortality and life expectancy at birth, UP fares much worse compared to most of these states. These numbers seem to indicate that healthcare is much worse in UP than in other states.
The more cynical explanation is that UP under-reports data on disease outbreaks. However, deaths are hard to cover up; so data for maternal and infant deaths help reveal the true picture.
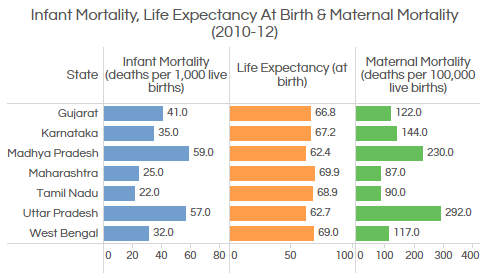
Sources: Indian Census, Data.Gov.in
Another answer placed before the Rajya Sabha provides statistics for the number of rape cases registered across different states.
Here again, 3,063 rape cases were reported in UP in 2013, while Madhya Pradesh (MP), which has around a third of UP’s population, reported 4,335 cases.
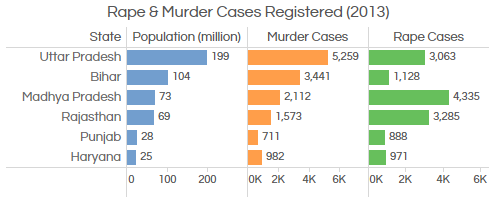
Sources: National Crime Records Bureau, Ministry of Home Affairs
The data on rape indicate that Rajasthan and MP have four and five times the crime rate of UP respectively and that women are safer in UP compared to other North Indian states.
However, this doesn’t seem to extend to other violent crimes.
For instance, the number of murder cases in UP is more than twice that of MP and more than three times the figure for Rajasthan.
The more cynical explanation, again, is that rape cases are severely under-reported in UP.
It is widely believed that such cases are severely under-reported across India, but the problem seems much worse in UP. In the case of a murder, since there is a dead body that cannot be wished away, or the deed otherwise suppressed, the crime has to be registered.
Going by these statistics, under-reporting of rape cases appears rampant in Bihar, India’s third-most populous state, as well. Although Bihar has 103 million people, compared to MP’s 72 million, the number of rape cases registered in Bihar is a fourth that of MP. The number of murders is more closely in line with the population.
These statistical inconsistencies are also evident in other areas. Consider traffic accidents across major cities, for instance.
Bhopal, the capital of Madhya Pradesh, reported 3,294 road accidents during 2013. Lucknow, UP’s capital, which is almost 50% larger, reported just 1,254 accidents.
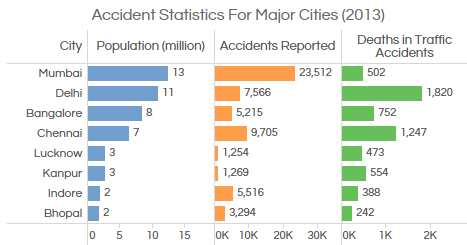
Source: Indian Ministry of Road Transport & Highways
Does this mean drivers in Lucknow are more careful than those in Bhopal?
The number of road accident deaths in Lucknow is almost twice that of Bhopal. Does this mean, perhaps, while there are fewer accidents in Lucknow or Kanpur, those that happen lead to more deaths?
What these numbers probably indicate is that accidents are under-reported in Lucknow and Kanpur. As with murder, if there has been a fatality in an accident, the dead body cannot be wished away and the case must be recorded.
The under-reporting of accidents also occurs in other metropolitan cities, led by India’s capital.
For instance, Mumbai and Delhi have similar populations, 12 million and 11 million, respectively; Delhi has far more vehicles, but Mumbai recorded thrice as many accidents.
Does this mean Mumbai drivers are more reckless?
Not necessarily because the number of fatalities in road accidents in Delhi is 260% higher. It just means Mumbai does a better job at reporting accidents than Delhi, which has a term for under-reporting by the police: burking.
The larger point is that statistics collected by state governments can be and are easily fudged. To bring down crime or disease, we first need to report it accurately, which does not appear to be happening in large parts of India.
 Amit Bhandari is a media, research and finance professional and a contributor of IndiaSpend. He holds a B-Tech from IIT-BHU and an MBA from IIM-Ahmedabad. You can reach him at amitbhandari1979@gmail.com

This work is licensed under a Creative Commons Attribution-NoDerivatives 4.0 International License
Republish our articles for free, online or in print, under a Creative Commons license.
Republish this article
This work is licensed under a Creative Commons Attribution-NoDerivatives 4.0 International License
Read Next
Data Journalism
GIJN’s Data Journalism Top 10: World Cup, South Africa’s Pit Toilets and France’s Deadly Police Interventions
What’s the global data journalism community tweeting about this week? Our NodeXL #ddj mapping from June 11 to 17 finds three data stories about the World Cup, from @BBCSport, @FT and @TspLeute, @guardian looked at at how urban cycling can change the world and @Bastamag explores 40 years of deaths from police interventions in France.

Data Journalism
Opening Up Data in Russia’s Closed System
As one of Russia’s few data journalists, Anastasia Valeeva has trained dozens of journalists in the former Soviet Union, the Balkans and Europe. Her recent study for the Reuters Institute at Oxford University delved into the ways investigative journalists are using open data in Russia. She spoke to GIJN’s Olga Simanovych about what she found.
Data Journalism
Top Ten #ddj: The Week’s Most Popular Data Journalism Links
Here are the top data journalism tweets for Mar 27- Apr 2, per our NodeXL mapping: interactive graphics (@driven_by_data); ridiculous news (@twisteddoodles); Malofiej Infographics Awards (@malofiej); Germany’s radio masts (@stimmeonline); Republicans voting with Trump (@FiveThirtyEight); & more.
Data Journalism
Top Ten #ddj: The Week’s Most Popular Data Journalism Links
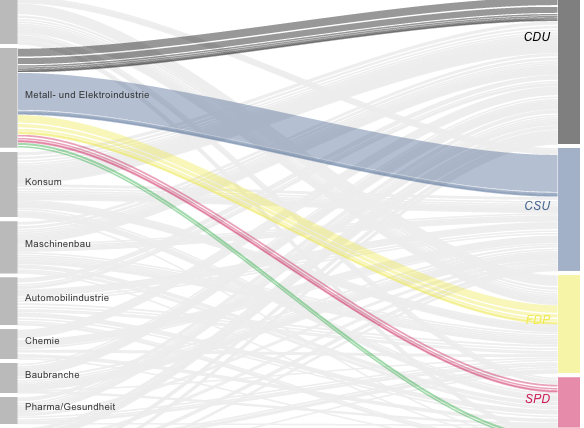
What’s the data-driven journalism crowd tweeting about? Top Ten links for March 27 – Apr 5: journalists and coding, 30+ free data tools, #ddj for beginners, asbestos in Italy, political money in Germany, and more. This list is determined by NodeXL, a social media network mapping program. The full map is available at the bottom of this roundup.