Accessibility Settings

color options

monochrome muted color dark

reading tools

isolation ruler

Tag

vaccinations

2 posts

Data Journalism

Data Journalism Top 10: Chaos in Kabul, Heat Deaths, Earth’s Biomass, Mapping Global Wildfires, Smearing the Greens

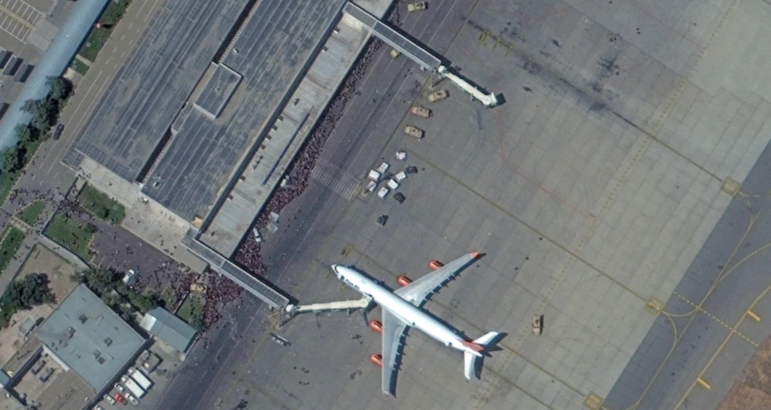
Our mapping of top data journalism links from August 16 to 22 found maps by The New York Times and Washington Post showing chaos at Kabul airport as thousands flee the Taliban, an investigation into heat-related deaths by NPR and Columbia Journalism School, a look at a mysterious poster campaign attempting to smear Germany’s Green party, and a comprehensive visualization of Earth biodiversity.

Data Journalism

Data Journalism Top 10: Hawaii’s Disappearing Beaches, Stolen Paintings, Investigating Disappearances, Herd Immunity Calculator

Hawaii’s scenery can be breathtaking, with cliff-rimmed white-sand beaches and surf-worthy waves. But our NodeXL #ddj mapping (Dec. 28-Jan. 3) found ProPublica highlighting dramatic erosion of the island state’s beaches over the past century. Also in this edition, we feature an interactive graphic to calculate the time to achieve COVID-19 herd immunity based on the US vaccination rate, a global vaccine distribution tracker, Federica Fragapane’s visualization of stolen paintings, and a compilation of 2020’s best data visualization lists.