Data Journalism
10 Tips for Visualizing COVID-19 Data
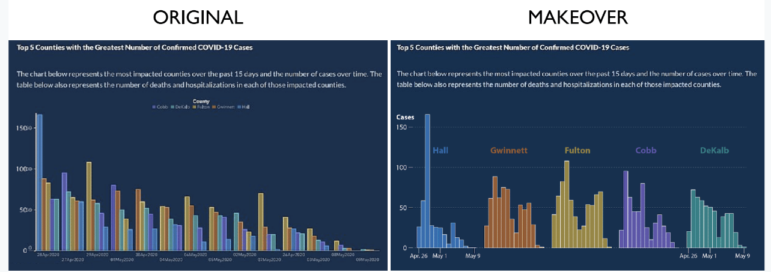
In the latest webinar in the GIJN series on Investigating the Pandemic, an investigative reporter, a health data expert, and a world-renowned visualization professor shared insights on what newsrooms should consider when presenting COVID-19 information visually. An online audience of journalists from 46 countries heard that clear explanation and transparency were critical for all graphic formats.
