Accessibility Settings

color options

monochrome muted color dark

reading tools

isolation ruler

Tag

colors

2 posts

Data Journalism

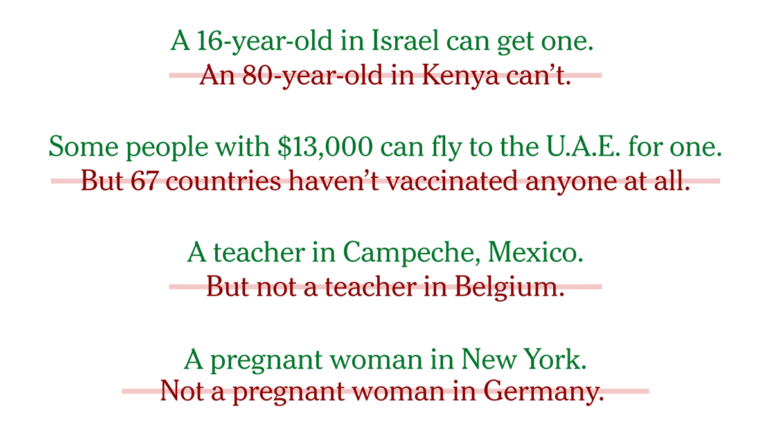
Data Journalism Top 10: March Madness, Trafficking Tigers and Fish, Color Palettes, Vaccine Inequality, Domestic Work

A lack of comprehensive data can seriously hinder efforts to track illicit activities. But persistent reporters will always find a way to get a glimpse of the real picture. Our NodeXL #ddj mapping from March 15 to 21 found Oxpeckers investigating the trafficking of tigers in Europe and journalist Ben Heubl offering advice on investigating illegal fishing. We also feature an analysis of the global aviation crisis by the Financial Times, a guide to color scales by visual storytelling expert Lisa Charlotte Rost, and a look into the burden of unpaid domestic work by data analyst Hassel Fallas.

Data Journalism

Data Journalism Top 10: Death and Wealth, Internet Privacy Tool, COVID Under Control, Dataviz Colors

“Death is the great equalizer,” or so the saying goes. But our NodeXL #ddj mapping from September 21 to 27 finds an investigation by The Boston Globe Spotlight team that proves otherwise: race and income influences how and when people die. In this Top 10 #ddj edition, we also found The Markup launching its new privacy tool, the Financial Times examining how Finland, and the cities of Madrid and New York City handled the pandemic, as well as a great guide by Datawrapper’s Lisa Charlotte Rost to choosing better colors for your charts.