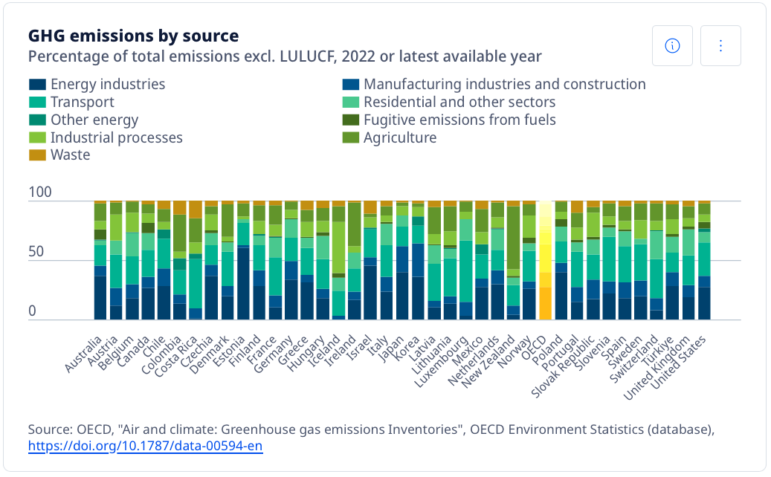
A graphic compiled by the OECD on greenhouse gas emissions, by source and country, from its March 2025 Environment at a Glance Indicators report. Image: Screenshot, OECD
As Trump White House Disappears US Environmental Data, Reporters Can Turn to OECD
Even as the Trump administration seems intent on disappearing environmental data, journalists can find stacks of it elsewhere.
For some environmental projects, for instance, you might turn to the Organisation for Economic Co-operation and Development, better known as the OECD.
Although the global policy forum tends to be Eurocentric, with limits to its efforts to offer information on a global scale, the wide range of international environmental data it does offer is still extensive in scope and comparatively reliable.
It may just have what you need.
Where the Data Comes From
The OECD originated more than 60 years ago as an outgrowth of the Marshall Plan, the post-World War II US and Canadian initiative to restore the wreckage of Europe and other countries from the war.
One way to view it is as a collection of 38 member states, most of them in Europe, but members also include Japan, South Korea, Colombia, and Australia. China and India participate as nonmembers.
It is similar to some other multinational organizations — such as the G7, the G20, and APEC. It has evolved in its own way, taking on aspects of a think tank, going beyond the topic of economic development to take in environmental issues as well.
OECD is arguably somewhat less political than some of these other multinationals. It works through a vast warren of committees on various issues.
OECD says it “contributes data, evidence-based analysis, standards and tools to help these global fora design innovative policy solutions in areas ranging from trade, investment, regulatory reform and taxation to AI, the digital and green transitions and gender equality.”
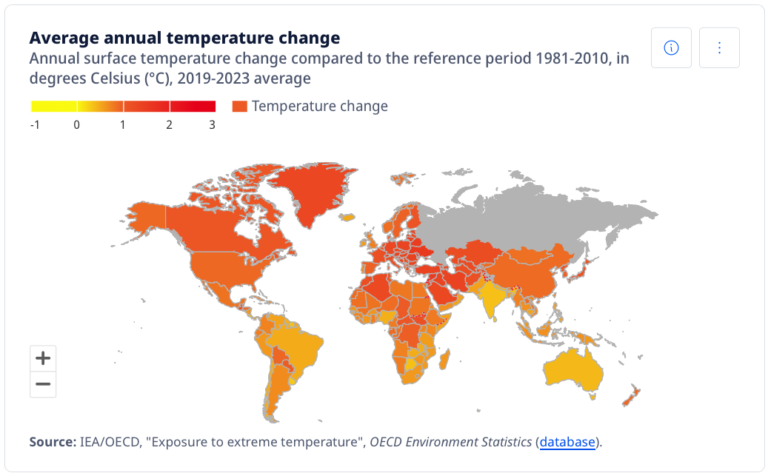
A graphic from the March 2025 Environment at a Glance Indicators report, showing the average annual temperature change, by country, from 1981-2023. Image: Screenshot, OECD
Using the Data Smartly
We especially like the part about “evidence-based,” and are willing to take it at face value.
It aggregates its data in ways that emphasize regional trends. OECD produces lots of reports and research papers, some of which focus on individual nations.
We regret to report, however, that the data sources OECD uses are not very obviously documented. Presumably, most of the data they offer comes from the subject nations themselves, which does not boost credibility.
Also, we found that some of the nifty “dashboards” promoted on its website didn’t work when we tried to access them (could have been a temporary glitch.)
Nonetheless, the graphics OECD produces from its data are well done and conceptually helpful. They are especially effective with nation-by-nation comparisons.
What’s good about the OECD data is the wide range of subjects it covers. Here are some examples from the environmental realm (although certainly not all that OECD covers):
- Transboundary movements of waste: An important subject, fundamental to several international treaties and to the emerging plastics treaty.
- Agricultural trade, policy, and sustainability: Includes data on agricultural emissions.
- Fisheries and aquaculture: Covers the status of fish stocks and international trade in fish products. Includes the effects of climate, illegal fishing and fishing pressure.
- Climate change: Includes data on adaptation and resilience, as well as international finance. Also, the deployment of green technology.
- Chemical safety and biosafety: Focuses on both industrial and consumer chemicals, and their environmental health consequences.
- Water: Includes water supply and management both among and within nations, and also water quality and pollution control measures.
Because of the limits of OECD data, we recommend that you supplement it whenever possible with other data — for example, adding full international coverage from UN agencies.
As always, remember that the data is just part of most good stories and that you must do the shoe-leather reporting to give it human dimension.
Editor’s Note: This post was originally published by SEJournal and is republished here with permission.
 Joseph A. Davis is a freelance writer/editor in Washington, DC who has been writing about the environment since 1976. He writes SEJournal Online’s TipSheet, Reporter’s Toolbox, and Issue Backgrounder, and curates SEJ’s weekday news headlines service EJToday and @EJTodayNews. Davis also directs SEJ’s Freedom of Information Project and writes the WatchDog opinion column.

Resources on Environmental Data

Remote Sensing and Data Tools for Environmental Investigations
How Environmental Journalists Can Use NASA’s New Landsat 9 Satellite

Tips for Building a Database for Investigations

There Has Never Been a Better Time for Environmental Journalism

Using Data Sources to Track Harmful Climate Crisis-Fueled Algal Blooms

Investigation Reveals Global Fisheries Are Worse Off — and Many Have Already Collapsed

NASA’s Worldview Site Expands Data and Environmental Reporter’s Toolbox

This work is licensed under a Creative Commons Attribution-NoDerivatives 4.0 International License
Republish our articles for free, online or in print, under a Creative Commons license.
Republish this article
This work is licensed under a Creative Commons Attribution-NoDerivatives 4.0 International License
Read Next
News & Analysis
There Has Never Been a Better Time for Environmental Journalism
The press in the US faces daunting challenges with the return of President Donald Trump, but holding his administration accountable makes environmental journalism that much more vital.
Data Journalism Reporting Tools & Tips
Using Data Sources to Track Harmful Climate Crisis-Fueled Algal Blooms
For the SEJ’s Reporter’s Toolbox: datasets and sources useful for tracking the harmful impact of climate change-fueled algal blooms.
Climate News & Analysis
Investigation Reveals Global Fisheries Are Worse Off — and Many Have Already Collapsed
In this story, an academic researcher recounts his team’s investigation, published in the journal Science, that looked into the accuracy of models measuring the health of fisheries.
Data Journalism Reporting Tools & Tips
NASA’s Worldview Site Expands Data and Environmental Reporter’s Toolbox
NASA’s Worldview database is a valuable tool that journalists can use to find data and free graphics on a range of topics, like wildfires, floods, deforestation, and many more.