Image: Screenshot, Bloomberg
What’s Next for a Devastated Gaza, TikTok’s Addictive Algorithm, Trump Food Aid Cuts Hit the Poor, Ukraine Strikes Russian Energy
The Washington Post analyzed more than 15 million TikTok videos from 1,000-plus users, revealing how the app’s hyper-personalized algorithm and endless scroll function propel addictive use. In this edition of our Data Journalism Top 10, covering stories from October 2 to 21, we also feature ProPublica’s in-depth look at the impact of Trump’s cuts to SNAP and TEFAP food programs, a visual analysis by Data for India exploring the importance of the country’s custom tailoring economy, and CNN’s tracking of the growing US military presence in the Caribbean.
TikTok’s Addictive Algorithm
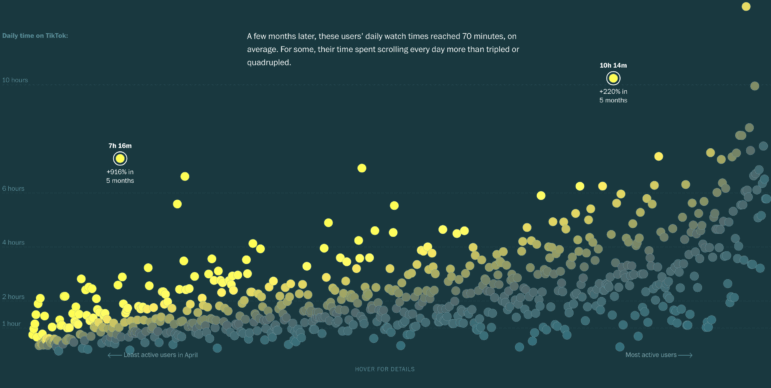
Image: Screenshot, The Washington Post
The Washington Post dived into TikTok’s addictive design, analyzed the watch histories from over 1,100 users, including 800 in the US, and created a database of more than 15 million videos from April 1 to September 5, 2024. Participants were divided into quintiles based on average daily usage on the app during the first week of April, with the bottom and top quintiles representing “lighter,” or least active, and “power,” or more active, users. Researchers tracked three metrics: daily watch time, number of app sessions, and time between consecutive swipes. The Post visualized side-by-side changes between the two cohorts over five months, showing that lighter users’ daily watch time more than doubled from 30 to 70 minutes, while power users exceeded four hours. TikTok’s hyper-personalized algorithm and endless scroll feature accelerated engagement, shortened swipe intervals, and reinforced habitual usage. According to internal TikTok documents revealed in a lawsuit, it takes just 260 videos, or about 35 minutes, to form a habit on the app.
Trump Food Aid Cuts Hit the Most Vulnerable
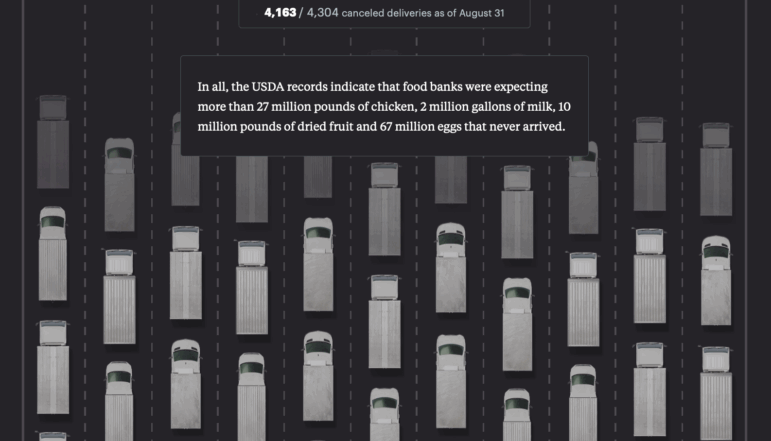
Image: Screenshot, ProPublica
In early 2025, the US Department of Agriculture announced a US$500 million cut to TEFAP — a key program supplying farmer-produced food to food banks, and in July, Trump’s budget bill made the largest cuts to SNAP provisions in the program’s history, reducing federal funding by US$187 billion through 2034. ProPublica obtained detailed Department of Agriculture records documenting 4,304 canceled or reduced deliveries of essential items, including meat, dairy, eggs, and produce, between May and September 2025 across all 50 states, Puerto Rico, and Washington, DC. The analysis tracked shipment type, quantity, and intended destination, while reporters conducted on-the-ground interviews at food banks to capture the human impact. The findings show that many families received smaller or lower-quality packages, and in some cases, donations spoiled before reaching recipients, highlighting how Trump’s widespread cuts have greatly disrupted food distribution for vulnerable communities at the same time that food insecurity has reached its highest level since the Great Recession, according to federal data.
Bespoke Tailoring’s Rise in Indian Manufacturing

Image: Screenshot, Data for India
Custom tailoring has long been woven into India’s sartorial fabric, and new analysis from Data for India shows how this tradition has become a major force in the country’s manufacturing economy. The sector grew from under four million workers in 2005 to around 12 million in 2024, with one in six manufacturing workers now in custom tailoring. Drawing on Periodic Labour Force Survey data and national statistics, the authors examined two decades of employment trends, finding that women now make up 72% of the workforce and that most work informally. Through simple visualizations, including bar, line, and area charts, the findings underscore how tailoring shapes the backbone of the manufacturing industry, despite being misclassified by India’s National Accounts Statistics — used to calculate sector contributions — and thus obscures the true economic weight of custom tailoring.
Mapping a Wildfire in One of Africa’s Largest Nature Reserves
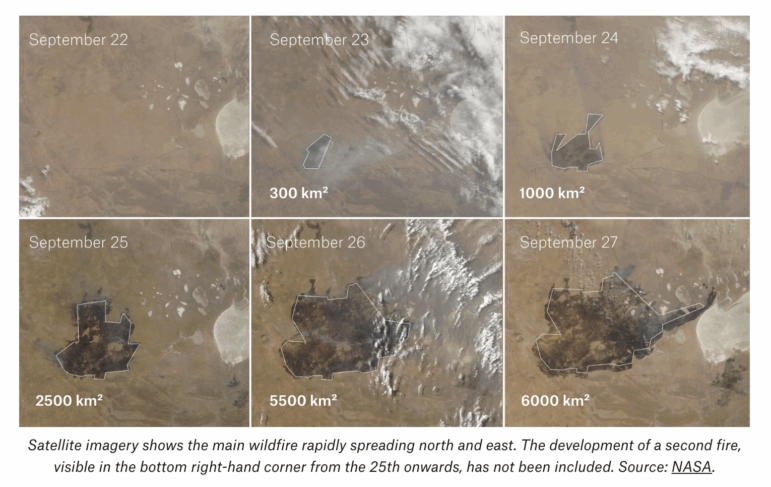
Image: Screenshot, Bellingcat
In late September 2025, wildfires swept through Namibia’s Etosha National Park, one of Africa’s largest nature reserves, destroying more than a third of it, including critical grazing areas for endangered species such as black rhinos, giraffes, and elephants. Bellingcat analyzed NASA satellite imagery, Copernicus Sentinel-2 data, and other open source geospatial resources to track the fire’s progression from September 22 to 30, finding that at least 7,000 square kilometers (2,702 square miles) of the reserve was affected. Satellite imagery shows the growth of the fire over six days — the time it took for the Namibian government to respond to the incident. Analysts cross-referenced satellite data with local reports, park records, and images, including a widely shared photograph of an injured elephant, to validate the scale of the damage, with experts describing the event as a “gigafire” exceeding one million hectares.
Ukraine’s Drone Strikes Targeting Critical Russian Energy
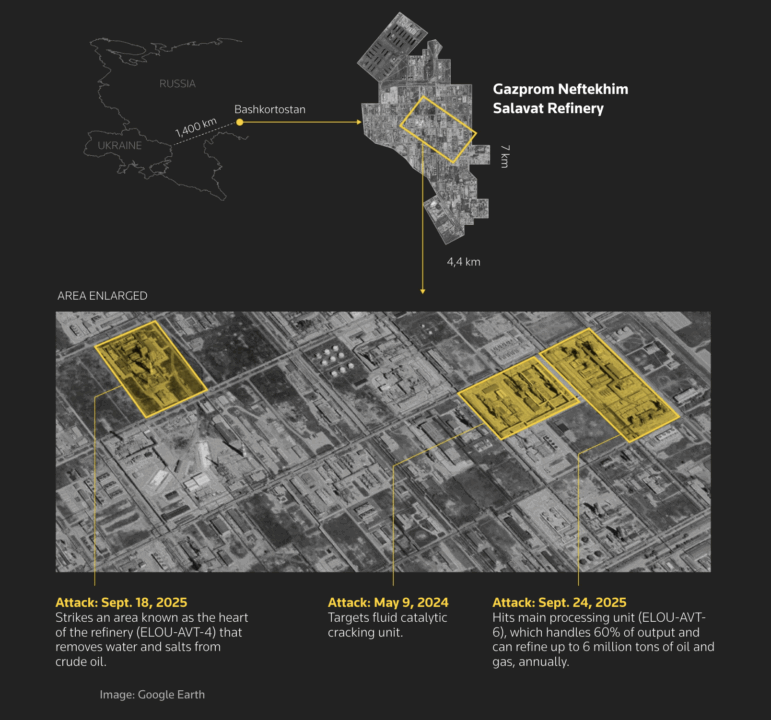
Image: Screenshot, Reuters
Since early August, Ukraine has launched at least 58 drone attacks on Russian energy infrastructure, sending drones up to 2,000 km (1,200 miles) into Russian territory. Drawing on findings from independent researchers and the UK-based Open Source Centre (OSC), Reuters also analyzed satellite imagery and cross-referenced footage and interviews with Ukrainian officials and energy experts. The strikes, specifically carried out by Ukrainian-made drones, knocked out roughly 17% of Russia’s refining capacity by mid-August, rising to 21% at the end of the month. The Reuters piece used detailed maps of strike locations, graphs tracking refining output, and illustrative models of Ukrainian drone configurations, showing how the attacks — more than half of which have been on oil refineries — have pushed domestic gasoline prices higher.
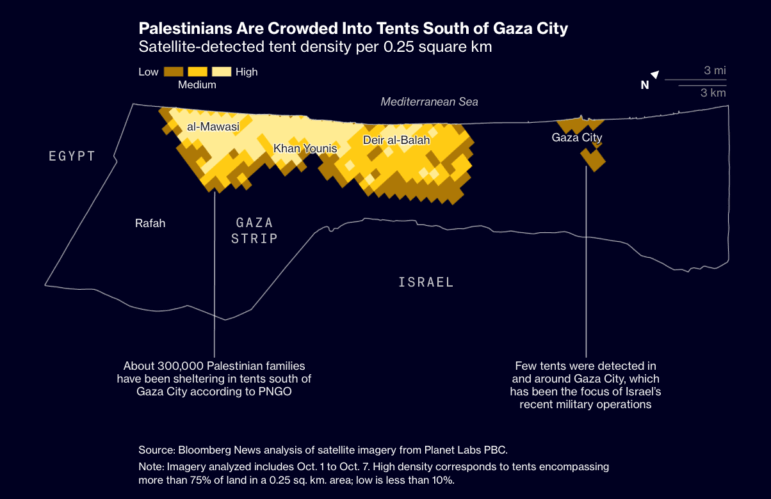
What’s Next for a Devastated Gaza?
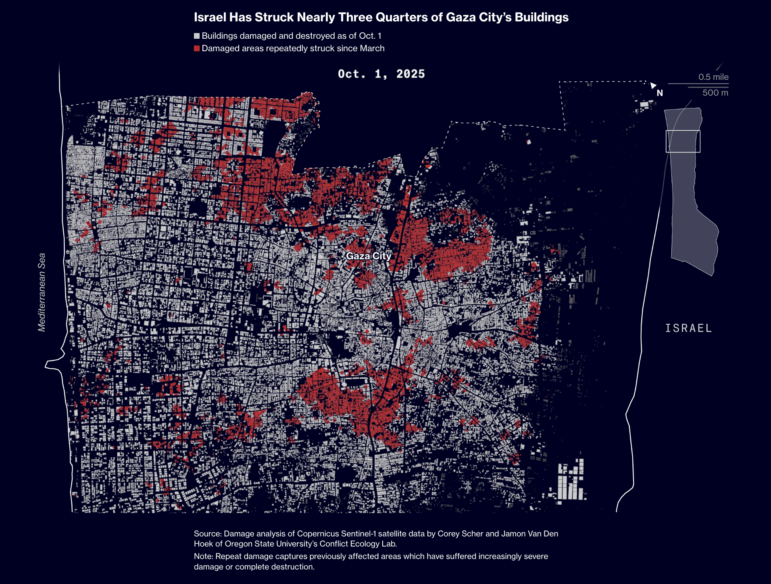
Image: Screenshot, Bloomberg
Following the announcement of a tenuous ceasefire deal in Gaza, Bloomberg examined the aftermath of two years of conflict in the Gaza Strip, where nearly all of its 2.2 million residents have been displaced, living in overcrowded camps that make up less than 10% of the territory. The report combined field accounts from the controversial Gaza Humanitarian Foundation, satellite imagery from Planet Labs, and damage assessments using Copernicus Sentinel-1 data. A scroll-activated map visualizes damaged buildings and tent density across Gaza, highlighting the scale of destruction and humanitarian need. The report details ongoing food, water, and medical shortages, with millions reliant on aid, while noting that reconstruction, governance, and security remain uncertain. Political tensions could, and have, triggered renewed violence.
Tracking the US Military Buildup in the Caribbean
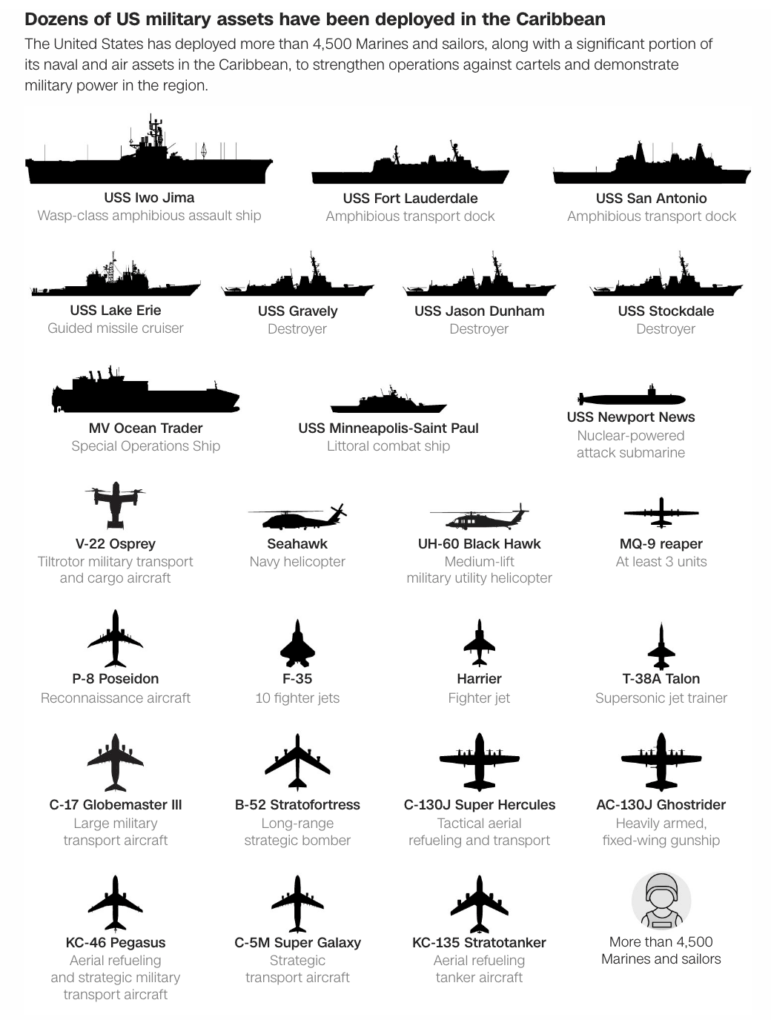
Image: Screenshot, CNN
Over the past two months, the Trump administration has conducted a major military buildup in the Caribbean. It has deployed more than 4,500 marines and sailors, F-35 fighter jets, drones, and multiple naval assets, while carrying out deadly strikes on vessels that the administration claims are linked to Venezuelan and Colombian drug traffickers. CNN analyzed over 200 military flights between August 15 and October 15, using open source flight data from ADS-B Exchange, thebaldgeek’s airframes.io dashboard, FlightRadar24, and LatAmMilMovements to track aircraft types, missions, and locations. The report found the missions involved 83 aircraft, including intelligence-gathering planes and aerial refueling. Satellite imagery and a visual of deployed assets suggest a provocative series of operations meant to put pressure on the Venezuelan government.
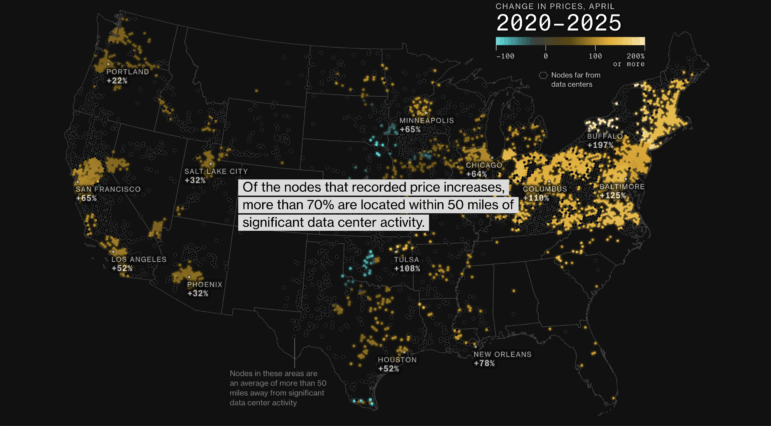
How Chipmakers and AI Labs Are Interconnected
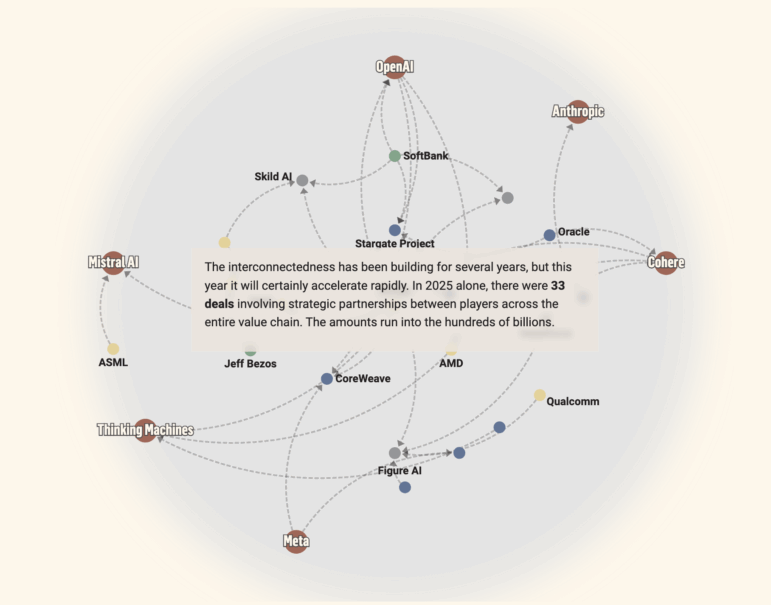
Image: Screenshot, De Tijd
AI companies, chipmakers, and cloud providers have become tightly interconnected through billions of dollars in strategic partnerships and cross-shareholdings, which analysts warn may lead to an AI bubble, with circular investment models inflating stock prices and leading to supply chain issues. De Tijd mapped major deals and partnerships in 2025, tracking announced investments and commercial agreements in an interactive network diagram. Companies were coded by category: AI models, hardware, infrastructure, investors, and applications, to illustrate the triangular relationships that have formed across the tech sector. The report highlighted OpenAI’s billion-dollar deals with chip-making giants such as AMD and Nvidia, alongside partnerships involving CoreWeave, Microsoft, and other major players, showing how shares in companies are being exchanged for computing power and expertise. De Tijd’s mapping shows that Nvidia has become the most connected hub, investing across rivals, cloud providers, data centers, and AI startups.
Brazil’s Drilling in Sensitive Amazon Regions
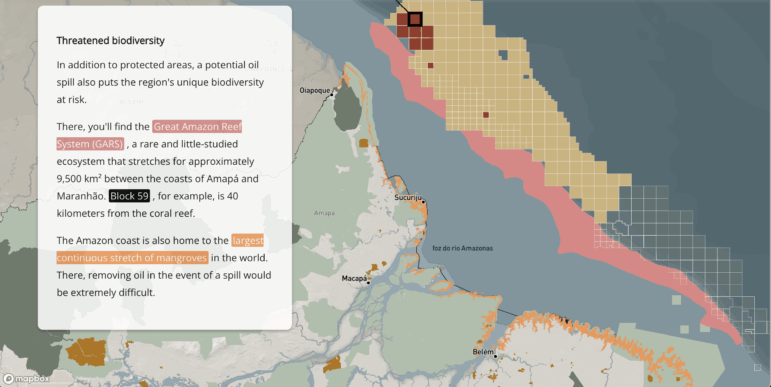
Image: Screenshot, InfoAmazonia
InfoAmazonia reported that Brazil’s environmental agency, Ibama, granted state-run oil company Petrobras a license to drill in the Foz do Amazonas basin. The well to be drilled is located on Brazil’s equatorial margin, home to the world’s largest continuous stretch of mangroves and the Great Amazon Reef System. Other areas were auctioned in the region during the summer, with ExxonMobil, Chevron, CNPC, Shell, BP, Brava Energia, and Prio now holding exploration blocks. Using data from the National Agency of Petroleum, Natural Gas, and Biofuels (ANP), InfoAmazonia showed that one in four wells on the equatorial margin was historically disrupted by mechanical accidents. Using Mapbox, InfoAmazonia created an interactive scrolly map and visualized drilling sites, and the ecological risks, with data indicating that oil spills could affect Indigenous territories, conservation units, and local biodiversity.
Climate Change Impacts on Bird Migration
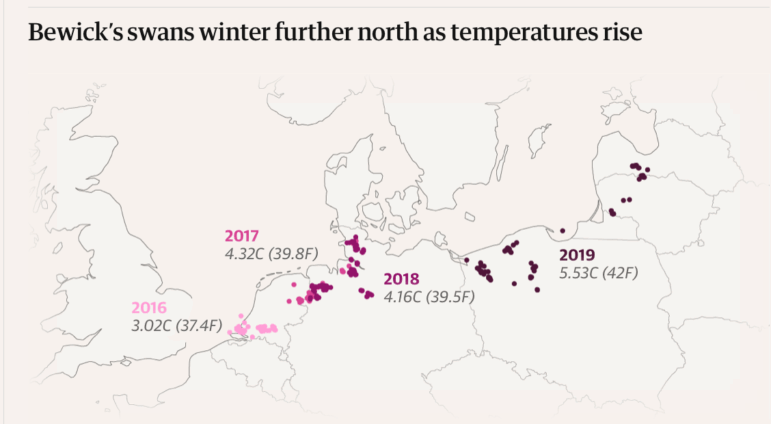
Image: Screenshot, the Guardian
The Guardian’s interactive mapping project examined how climate change has reshaped the routes and timing of bird movements across the globe. Using global temperature data from CHELSA (1981–2010) and vegetation data from NASA’s Terra/MODIS, the project visualized shifting habitats and altered flight paths. Built on GPS tracking data from dozens of species, such as nightingales, Bewick’s swans, and Desertas petrels, it showed how rising temperatures, stronger winds, and more frequent storms have transformed migration patterns. The visuals combined wind and hurricane data from Copernicus ERA5 and NOAA with layered relief maps from Natural Earth, while immersive audio recordings captured each species’ calls.
Hanna Duggal is a data journalist at AJ Labs, the data, visual storytelling, and experiments team of Al Jazeera and a GIJN contributor. She has reported on issues such as policing, surveillance, and protests using data, and reported for GIJN on data journalism in the Middle East, investigating algorithms onTikTok, and on using data to investigate tribal lands in the US.

Open Source Guide to Investigating Chinese Companies

Reporter’s Guide to Detecting AI-Generated Content

Guide to Investigating Social Media Algorithms
GIJN Reporting Guide for Landfill Methane Emissions and Solutions
Data Centers’ Impact on Utility Prices, UK’s Far-Right Online, Fatal Consequences of USAID Cuts, Drone Strikes on Kyiv
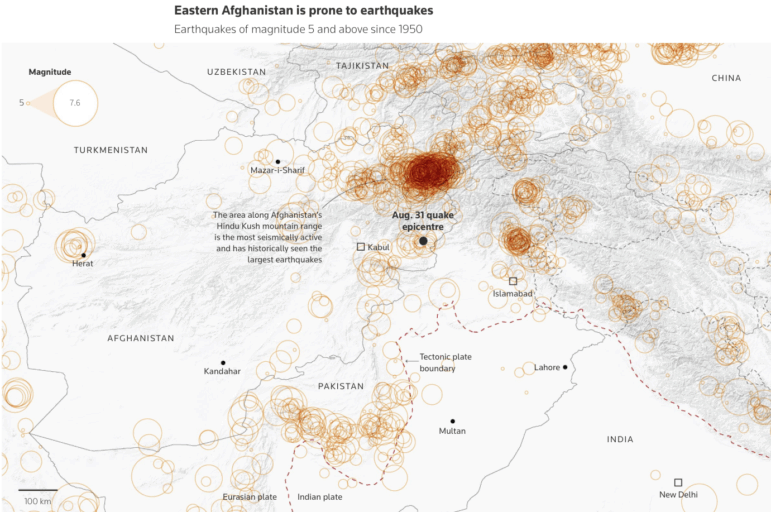
Afghanistan’s Deadly Earthquakes, West Bank Settler Violence, Mississippi’s Prison Homicides, Chile’s Data Center Boom
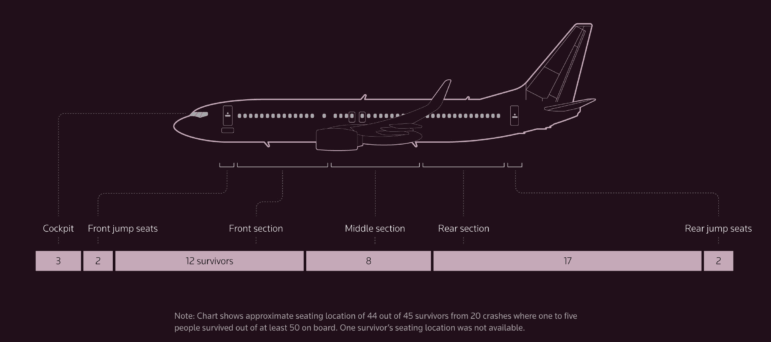
Where Plane Crash Survivors Sit, African Labor Fueling AI Hype, DOGE Guts US Health Agency, Syria’s Most Feared Prison
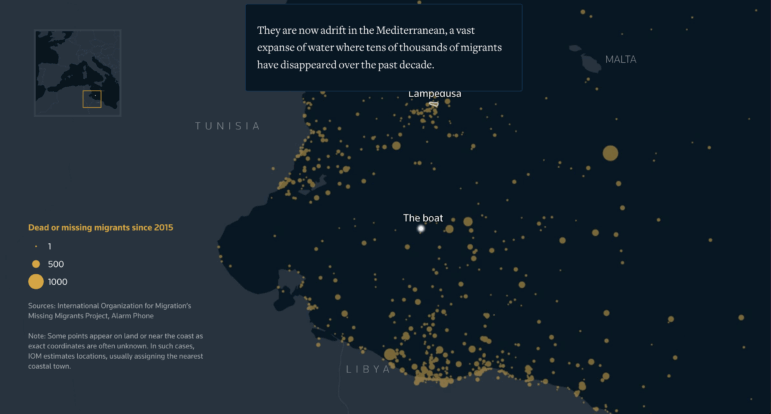
Deadly Mediterranean Migration, Putin’s Military Gains, Spain’s Enduring Wildfires, Gambling on Premier League Kits

This work is licensed under a Creative Commons Attribution-NoDerivatives 4.0 International License
Republish our articles for free, online or in print, under a Creative Commons license.
Republish this article
This work is licensed under a Creative Commons Attribution-NoDerivatives 4.0 International License
Read Next
Data Journalism Top 10
Data Centers’ Impact on Utility Prices, UK’s Far-Right Online, Fatal Consequences of USAID Cuts, Drone Strikes on Kyiv
Our round-up of the best in recent data journalism also features stories about fuel smuggling in Mexico, poverty in Nigeria, and typhoons in Hong Kong.
Data Journalism Top 10
Afghanistan’s Deadly Earthquakes, West Bank Settler Violence, Mississippi’s Prison Homicides, Chile’s Data Center Boom
Our round-up of the best in recent data journalism also features stories on Russia’s military equipment losses, Pacific deep-sea mining, and Paralympic swimming.
Data Journalism Top 10
Where Plane Crash Survivors Sit, African Labor Fueling AI Hype, DOGE Guts US Health Agency, Syria’s Most Feared Prison
Our latest round-up of the best in data journalism also features stories on Xi Jinping’s military purge and climate change-fueled flooding in Pakistan.
Data Journalism Top 10
Deadly Mediterranean Migration, Putin’s Military Gains, Spain’s Enduring Wildfires, Gambling on Premier League Kits
Our round-up of the best in recent data journalism also features stories from Japan, Nigeria, Gaza, and Namibia.