Sky News investigated whether the social media site X favors right-wing political rhetoric in the UK. Image: Screenshot
X’s Right-Wing Bias in UK, Tigray’s Illicit Gold Rush, Financial Risks of AI Bubble, and What People Ask ChatGPT
Sky News created dummy accounts to test whether the social media site X, under Elon Musk’s ownership, favors right-wing political rhetoric in the UK. Working with academics and a custom-trained language model, the experiment showed that users of all political leanings were consistently fed more right-wing content than left-leaning or neutral posts. In this edition of our Data Journalism Top 10, covering stories from November 5 to 17, we also feature Greek outlet Solomon’s investigation into livestock loss as a result of sheeppox in Greece, The Globe and Mail and The Bureau of Investigative Journalism’s exposé into illicit gold-mining in Ethiopia’s Tigray region, The Washington Post’s analysis of ChatGPT conversations, and National Geographic’s immersive journey into how the pyramids were built in Egypt.
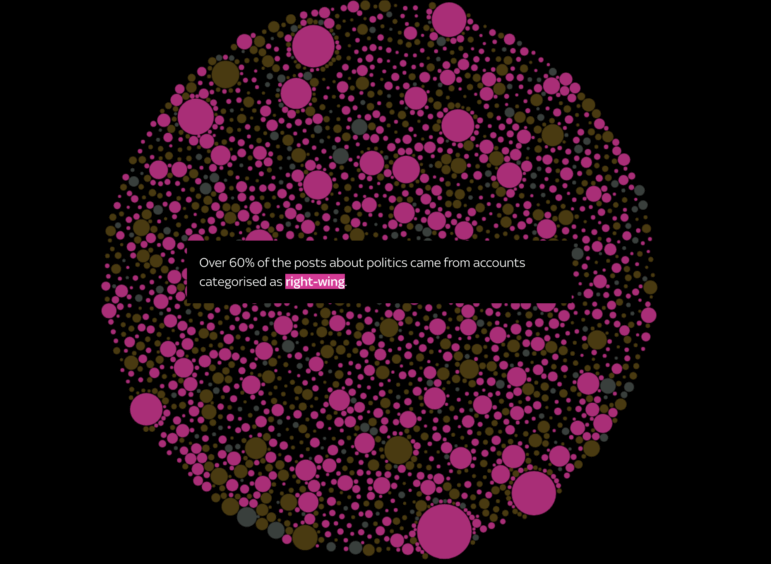
How Elon Musk’s X Pushes Extremist, Right-Wing Views in UK
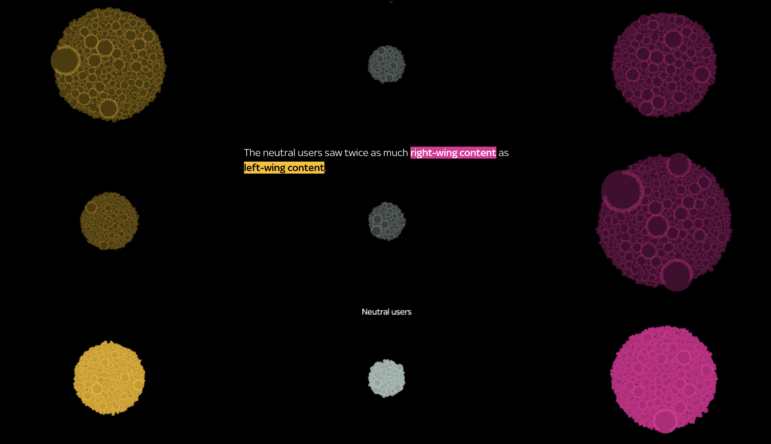
Image: Screenshot / Sky News
Sky News’s data and forensics team set out to test whether X’s algorithm favors right-wing politics by running a controlled experiment using nine newly created test accounts designed to mimic British users with left-leaning, right-leaning, or neutral interests. Over two weeks, the team collected posts from each account’s “For You” feed, building a dataset of 90,000 posts from 22,000 accounts. Working with academics, they classified nearly 6,000 accounts by political alignment using a custom-trained large language model. Using color-coded circle-packing charts, they found more than 60% of political content shown came from right-wing accounts, neutral users saw twice as much right-wing content as left-wing, and over half of all political posts originated from accounts classified as extreme — 37% of them from extreme right accounts that “that often include toxic language, such as dehumanizing language or endorsement of violence, or conspiracy theories.” The team said the findings “indicate a clear imbalance of content” on the platform owned by Elon Musk.
End of the Line for Saudi Arabia’s Sky-High City
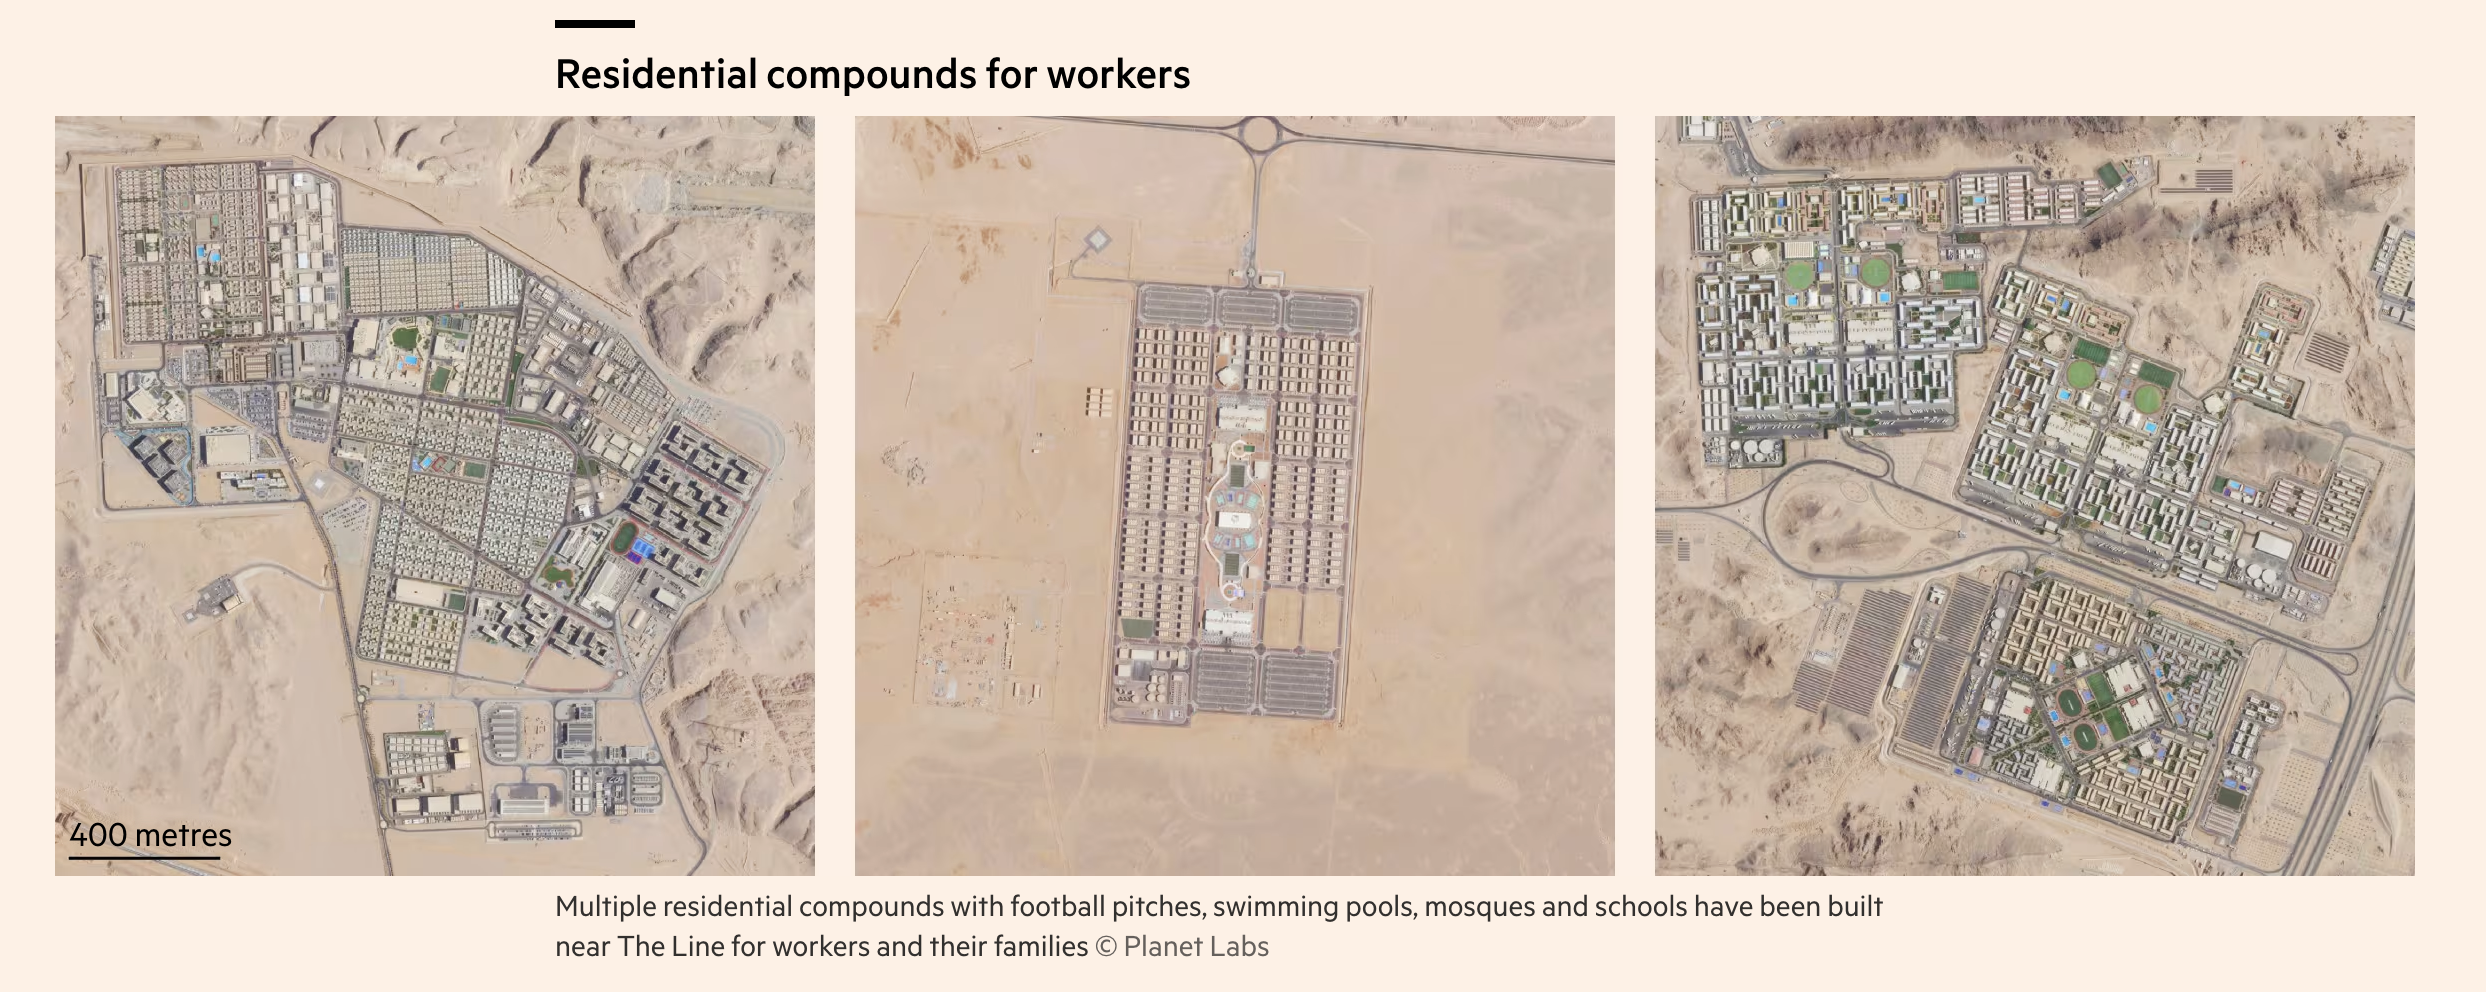
Image: Screenshot, FT
In this visual feature, the Financial Times charts the unravelling of The Line — Saudi Arabia’s ambitious plan to build a 500 meter-high mirrored city, Neom, for nine million people. Drawing on interviews with more than 20 architects, engineers, and former senior executives, the FT shows how Mohammed bin Salman’s flagship project has been strained by physics, logistics, and soaring costs. Using scrollymaps, scaled construction models, and before-and-after satellite imagery, the piece contrasts the project’s early promises with what has actually materialized on the ground. Construction has slowed dramatically, according to the report, and the project’s initial $1.6 trillion budget has ballooned to internal estimates of around $4.5 trillion, “roughly the size of Germany’s annual economic output.” Modules making up The Line would require quantities of steel, concrete, and cladding that would overwhelm global supply chains. Experts also warn that the structure would obstruct major bird and mammal migration routes, leaving insiders increasingly convinced that the project is drifting, “undone by the laws of physics and finance.”
Livestock Pox Outbreak in Greece
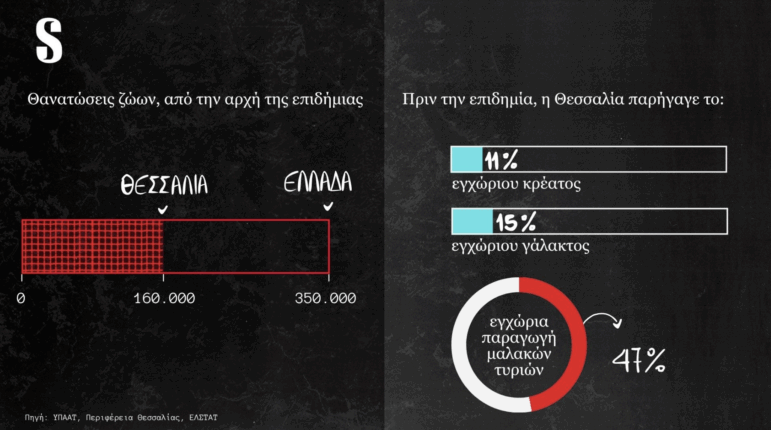
A graphic showing the number of animals killed since the start of the outbreak on the left, and detailing how vital Thessaly is in Greek agriculture. Image: Screenshot, Solomon
Reporters at the investigative outlet Solomon decided to delve into a major goat- and sheeppox outbreak in Greece, one of the country’s “worst livestock crises in decades.” Through access to internal correspondence from EU agencies and Greek authorities, and freedom of information requests, reporters showed that although the EU recommended early vaccinations before the epidemic spread from northeastern Greece across the mainland and into Thessaly, the national government instead decided to rely almost exclusively on the mass culling of animals. Solomon documented dozens of outbreaks across multiple regions as the pox spread. Since the outbreak began, more than 350,000 animals have been slaughtered nationwide, including over 160,000 in Thessaly alone, causing huge losses in milk and cheese production. Reporters also used satellite imagery to identify mass animal-burial sites amid warnings that poorly managed disposal poses risks of environmental contamination and future resurgence.
Rush for Gold in Ethiopia’s Tigray
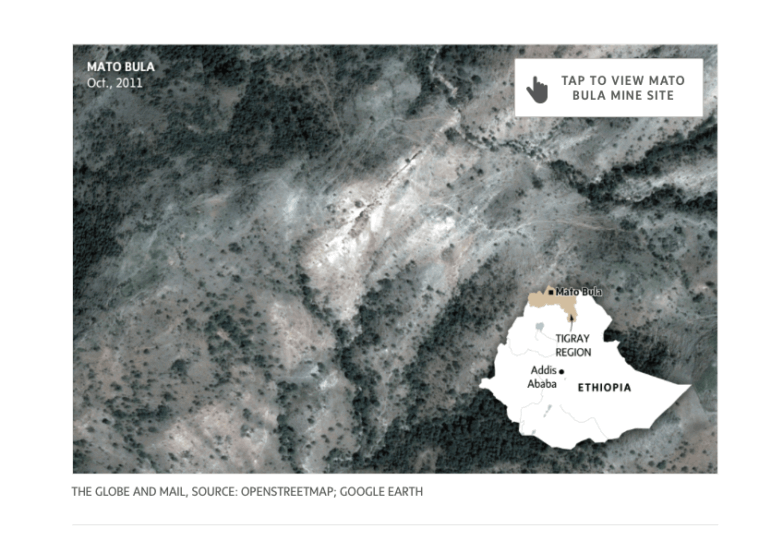
Image: Screenshot, The Globe and Mail
In post-war Tigray, a multibillion-dollar gold rush is gripping the region, lining the pockets of armed actors and foreign financiers while devastating local communities. A global surge in gold prices, driven by countries like the US and China racing to stockpile reserves, is part of what is driving the boom in a place “where an emerging resource economy must contend with a thriving illicit one.” Reporters from The Globe and Mail and the Bureau of Investigative Journalism spent weeks in the region diving into illicit mining in particular, interviewing miners, security officials, government insiders, and community members, and analyzed satellite imagery alongside hundreds of leaked documents, financial statements, and public records. Internal government data show Ethiopia’s central bank has bought more than 18,000kg of gold from Tigray’s artisanal miners — 30 times what the region was projected to legally produce.
How a Hidden River Help Build Egypt’s Pyramids
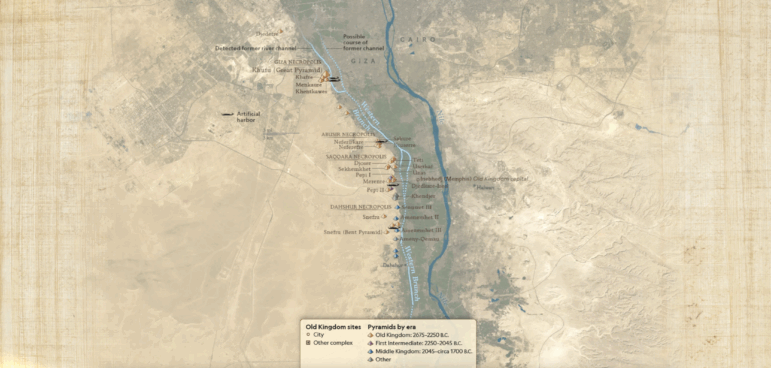
Image: Screenshot, National Geographic
National Geographic revisited the mystery of how the Pyramids of Giza — the last surviving Wonder of the Ancient World — were built. Drawing on a 4,600-year-old journal that was discovered along with the Red Sea Scrolls in 2013, the story hints at how a now-lost branch of the Nile was used to transport massive stone blocks to the plateau. In 2023, researchers used modern geophysical surveys, radar satellite imagery, and deep soil-coring, to trace the vanished waterway, which aligns not only with Giza but more than 30 nearby pyramids. The piece combines illustrated maps evoking papyrus scrolls with annotated diagrams and cutaway sketches that unpack the engineering behind the monument — from boating 15-ton blocks upriver to pulling them up more than 1,600-foot-long ramp systems, the immersive visual reconstruction reframed how the ancient Egyptians managed such a remarkable feat of engineering.
What Do People Ask ChatGPT?
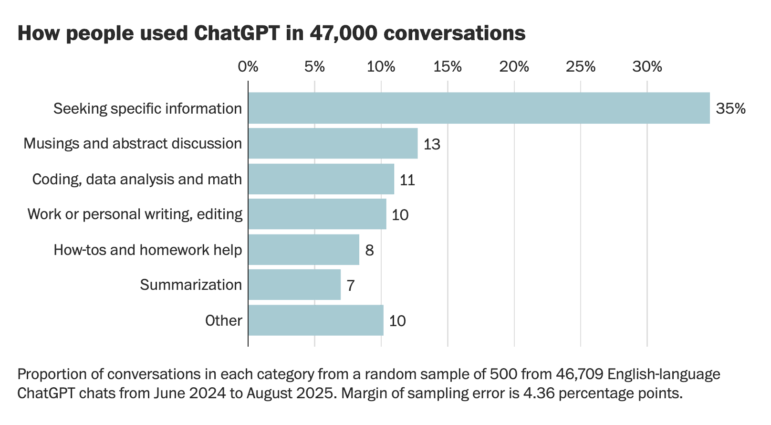
Image: Screenshot, Washington Post
According to OpenAI, more than 800 million people use ChatGPT every week. Although the vast majority of those conversations are private, The Washington Post was able to analyze 47,000 publicly-shared ChatGPT conversations to understand how people actually use the tool. Reporters downloaded more than 93,000 chats from the Internet Archive, focusing on 47,000 chat sessions since June 2024, conducted primarily in English. As they went through tens of thousands of exchanges, from relationship worries to philosophical debates, a telling pattern revealed itself: more than one in 10 conversations revolved around emotional or existential questions, and ChatGPT consistently echoed users’ views, using responses with “yes” nearly 10 times more often than “no.” The dataset also revealed how often people shared private information, sought legal or medical help, or nudged the model into endorsing conspiracies, offering a rare, data-rich glimpse into the way humans relate to AI.
Tracking the Hate Against NYC’s Next Mayor
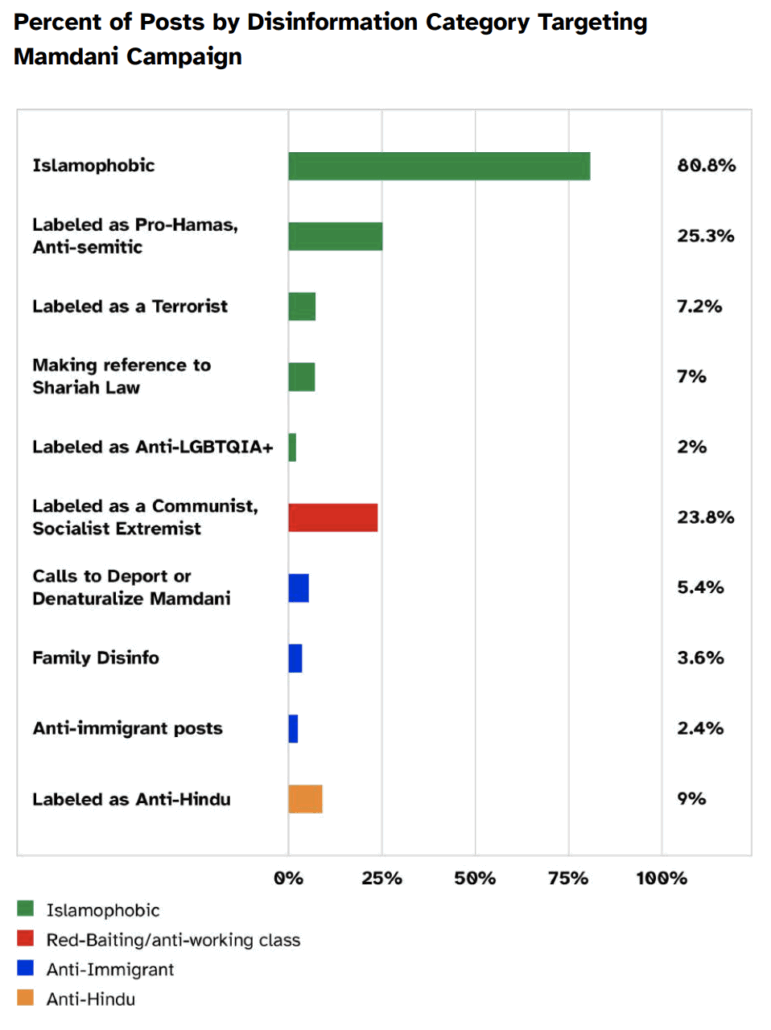
Image: Screenshot, Equality Labs
Zohran Mamdani, who was recently elected as New York City’s first Muslim and first South Asian-American mayor, was met with a surge of online hate during his campaign, according to this report by Equality Labs. The year-long research project set out to investigate the increase of Islamophobic and xenophobic online attacks against the candidate, who moved to the United States as a seven-year-old child. Using a mixed-methods approach, including qualitative coding and quantitative trend analysis, researchers manually analyzed 500 posts from June to October 2025 that targeted Mamdani, finding 80% of targeted posts were Islamophobic, 5% called for the politician’s deportation or denaturalization, and 3.6% featured disinformation about his wife and family. The study also mapped amplification networks, identifying the domestic and international political figures pushing “bigoted disinformation” narratives.
Risks of Another Tech Bubble?
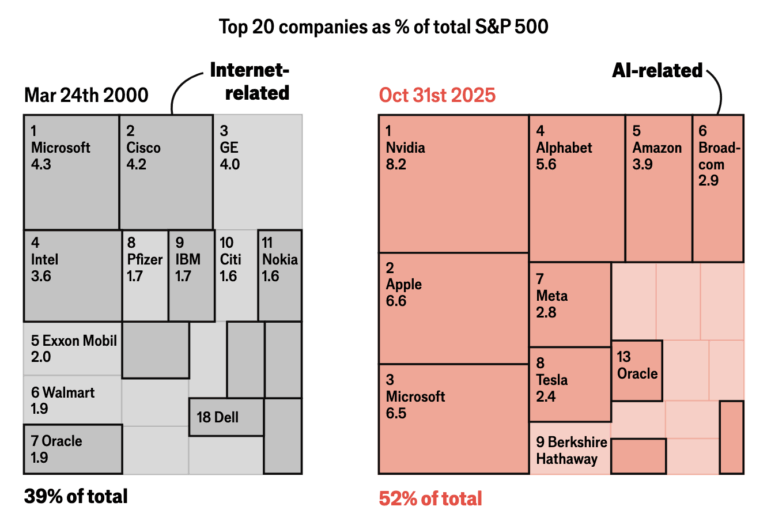
Image: Screenshot, The Economist
The Economist’s visual guide charted how today’s AI boom may be echoing the dotcom bubble of the early 2000s — and sets out the possible impact a market crash or correction might have. Drawing on historical market data, household-wealth statistics, and S&P 500 composition over time, its visualizations compared today’s “mania over AI” with those of the past. Line charts show the growth of the S&P 500’s market value as a share of US GDP, growing household exposure to equities, foreign versus domestic stock ownership, and the concentration of the index’s top 20 firms. Using treemaps, the data shows that AI-related tech valuations, led by Nvidia and other AI-heavy giants, now represent 52% of the S&P 500, higher than the 39% internet related firms made up at the height of the dotcom era. With US households holding $42 trillion in equities, The Economist estimates that a crash today would hit far more ordinary Americans.
Climate Accountability Since Paris Agreement
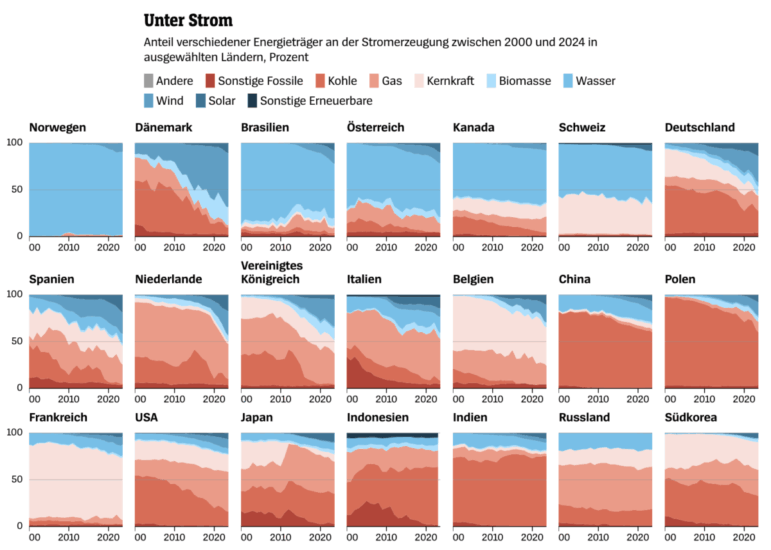
Tracking changes in the energy mix worldwide. Image: Screenshot, Der Spiegel
When the Paris Agreement was codified 10 years ago, nearly 200 countries pledged to limit global warming to 1.5°C. Using data from the Global Carbon Project, the International Energy Agency, and other sources, Der Spiegel had taken stock of which countries have followed through by reducing their greenhouse gas emissions. Through scrolling charts and country comparisons, the analysis shows how CO₂ emissions have shifted since 2015, for example, rising sharply in India and China while falling steeply in Germany and Scandinavian countries. Reporters visualized the record growth in solar and wind by comparing the energy mix of a selection of countries from 2000 to 2024 in a series of area charts. While the shift to renewables is a positive move, it isn’t offsetting slow progress in transport or the backpedalling of countries like the US who are now extracting more fossil fuels, reporters warned. By combining historical emissions data and current policy pathways, the piece points to a clear pattern: despite rapid advances in renewables, many climate researchers believe global emissions remain too high to keep the 1.5°C target alive.
Also of note this week, Die Zeit’s climate change interactive, which asks readers to imagine climate change in the context of how their children could live through it.
How Men and Women Spend Their Time
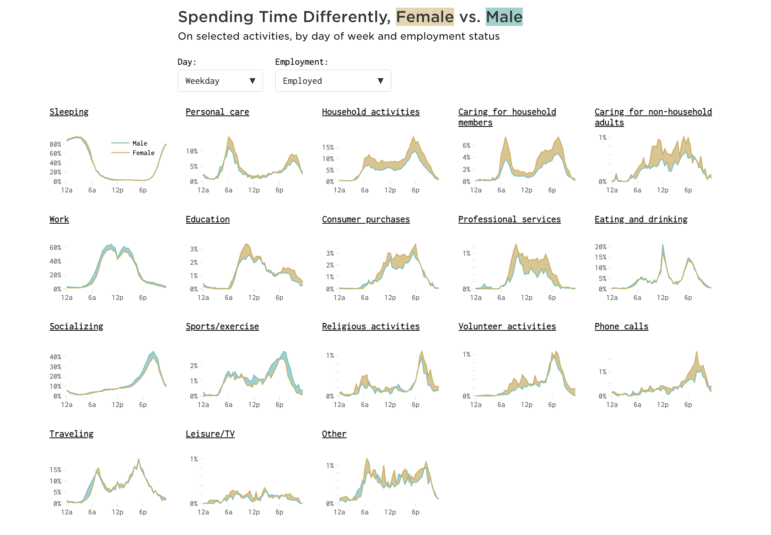
Image: Screenshot, Nathan Yau
Nathan Yau visualizes how men and women spend their days differently in the US using estimates based on data from American Community Survey, which asked participants to log what they do during a 24-hour period. Using a “difference chart,” which shows two overlapping lines of male and female time use, Yau found that women spend substantially more time on household tasks, such as cleaning, cooking, laundry, and caregiving, while men spend more time on work, sports, and socializing. The disparities hold consistently across weekdays, weekends, and employment status.
Hanna Duggal is a data journalist at AJ Labs, the data, visual storytelling, and experiments team of Al Jazeera and a GIJN contributor. She has reported on issues such as policing, surveillance, and protests using data, and reported for GIJN on data journalism in the Middle East, investigating algorithms onTikTok, and on using data to investigate tribal lands in the US.

Reporter’s Guide to Detecting AI-Generated Content

GIJN Reporter’s Guide to Investigating Digital Threats

Introduction to Investigative Journalism

Guide to Investigating Social Media Algorithms
What’s Next for a Devastated Gaza, TikTok’s Addictive Algorithm, Trump Food Aid Cuts Hit the Poor, Ukraine Strikes Russian Energy

How Non-Coding Journalists Can Build Web Scrapers With AI — Examples and Prompts Included
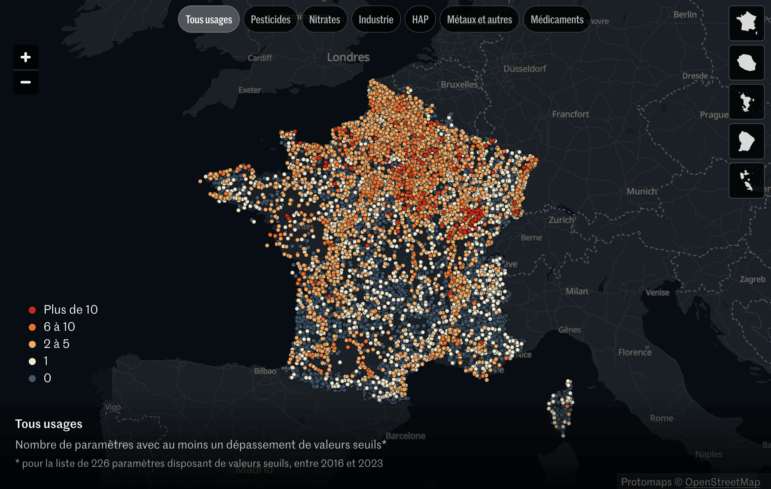
How a Le Monde Team Uncovered 300 Contaminants in France’s Groundwater

From Data to Storytelling: Concept and Design Tips from the Financial Times’ John Burn-Murdoch

This work is licensed under a Creative Commons Attribution-NoDerivatives 4.0 International License
Republish our articles for free, online or in print, under a Creative Commons license.
Republish this article
This work is licensed under a Creative Commons Attribution-NoDerivatives 4.0 International License
Read Next
Data Journalism Top 10
What’s Next for a Devastated Gaza, TikTok’s Addictive Algorithm, Trump Food Aid Cuts Hit the Poor, Ukraine Strikes Russian Energy
Our round-up of the best in recent data journalism also features stories on what happens next in Gaza, a wildfire in a Namibian nature reserve, and the rise of the bespoke tailoring market in India.
Data Journalism
How Non-Coding Journalists Can Build Web Scrapers With AI — Examples and Prompts Included
With basic web knowledge, guidance, and examples, even non-coding journalists can build a scraper with large language models.
Data Journalism How They Did It
How a Le Monde Team Uncovered 300 Contaminants in France’s Groundwater
The French investigative reporter and data journalist shares the methods behind her team’s major investigation into Europe’s polluted groundwater crisis.
Data Journalism
From Data to Storytelling: Concept and Design Tips from the Financial Times’ John Burn-Murdoch
The chief data reporter for the Financial Times discusses how he considers the use of text, color, and annotation to aid visual storytelling through charts and graphics.