
Image: Shutterstock
Data Cleaning Tools and Techniques for Non-Coders
Read this article in


Every country produces data, but not every country produces it in an organized manner. What matters is not just the volume of data, but how it’s standardized and structured. The messiest or most data usually comes from manual systems — processes run by humans without standardization. These systems are not only slow but make verification difficult and can lead to major errors.
Even countries that produce massive amounts of data often have datasets that are inaccessible, fragmented, or lack metadata:
- The United States produces huge volumes of data, but decentralized structures and legacy systems are common.
- China has massive platforms, but its closed infrastructure limits data sharing.
- India is a leading data producer, but inconsistent digitization reduces data quality.
- Brazil has strong transparency laws, but struggles to standardize data.
- In European countries (including Turkey), conflicting regulations sometimes create data incompatibilities.
- Countries such as Nigeria have limited infrastructure, which restricts their data ecosystem.
For investigative journalists, this means looking beyond the content of a dataset — considering how it was produced and structured is equally important. Why should journalists care about messy data markets? Because, just like big companies, public institutions, and NGOs, journalists often see only part of the story. The goal is to uncover what is hidden.
In this context, investigative and data journalism require different approaches depending on the type of data. Structured data — organized, often numeric, and table-based — is ideal for analysis, comparison, and visualization. Today, however, much of the digital world consists of unstructured data: emails, social media posts, customer reviews, videos, audio files, and other irregular content.
These datasets can be treasure troves of information, but their messy nature makes deep analysis difficult unless they are cleaned and organized. Today, around 80% of digital data is unstructured, posing a significant challenge for journalists: before conducting meaningful analyses or uncovering stories, the data must first be cleaned and organized.
According to market research firm DataIntelo’s 2024 report, the global unstructured data analytics market was valued at US$7.92 billion in 2024, and it’s expected to reach US$65.45 billion by 2033. This growth is driven by the huge expansion of digital content and AI integration. However, technological advancements do not automatically make data easy to work with — the need for thorough data cleaning is greater than ever.
Even in data-rich countries such as the US or China, messy data, missing metadata, and inconsistent formats make analysis challenging. PDFs, scanned documents, non-standardized Excel files, and restricted-access databases are all examples of data cleaning stories journalists must tackle.
Journalists often encounter Excel files, PDFs, complex tables from open data portals, or raw social media datasets published by various institutions. These datasets are typically inconsistent, incomplete, or erroneous. Coders can handle these issues with Python, R, or SQL — but not every journalist codes. Even without coding, failing to engage deeply with data can lead to serious errors.
GIJN’s Struck by Lightning: A Quick Lesson on Cleaning Up Your Data illustrates this perfectly. Using a large dataset of lightning strikes, it highlights how minor differences in the “activity” column — like “roofing” versus “working on the roof” — can result in misclassification. The article demonstrates that visualizing data without cleaning it first can produce misleading results and stories, making datacleaning not just a technical task but an ethical responsibility for journalists.
Fortunately, there are tools and resources to make these processes easier. GIJN’s Using Pinpoint to Organize Unstructured Data explains how the Pinpoint tool helps organize unstructured datasets. Working with messy data can feel like climbing an endless mountain, but such tools make it easier to extract meaningful insights from text, documents, and files.
Quartz’s data cleaning guide provides journalists with a framework, exploring the causes of poor data quality, missing metadata, and conflicting sources, and suggesting how to achieve reliable, meaningful datasets.
These examples show that data cleaning is not merely a technical skill — it’s a fundamental step for trustworthy journalism. Below we discuss the process of data cleaning.
What Is Data Cleaning and Why Is It Important?
Data cleaning (or data wrangling) means identifying and correcting errors, filling gaps, removing duplicates, and resolving inconsistencies in a dataset. This process ensures that data is reliable for analysis and reporting.
For example, if a city’s spending table lists the same department as both “Ankara Belediyesi” and “Ank. Bld.,” calculating total expenses becomes impossible. Similarly, mixed date formats or missing rows lead to misleading results. Dirty data produces dirty stories. That’s why cleaning is one of the most critical, though invisible, steps in a journalist’s investigation.
The main goal of cleaning is preparing data — deciding what datasets you need, what formats to use, which rows and columns to adjust, and documenting every step. Tracking processes, performing error checks, and maintaining documentation are all part of a sustainable workflow.
Cleaning Data Without Coding
In recent years, no-code tools have been developed to allow journalists to clean, organize, and analyze data using visual interfaces. Instead of writing complex code, these tools provide drag-and-drop features, filters, and automatic cleaning suggestions, freeing journalists to focus on storytelling rather than technical details.
Steps for Data Cleaning
Even without coding, cleaning data should follow a logical sequence:
- Understand the Data
Observe before cleaning.
How many columns?
Are there missing values?
Are spelling and formatting consistent?
Are dates in the same format? - Back Up the Original Data
Always copy the original file before cleaning. - Remove Duplicates
Many datasets contain repeated rows.
Google Sheets: Data → Remove Duplicates
OpenRefine: Facet → Duplicates - Identify and Handle Missing Values
Detecting empty cells.
Remove rows or fill missing values logically (e.g., copy the city name from above). - Standardize Formats
Correct capitalization.
Convert dates to a single format.
Standardize currency, percentages, etc. - Merge Categories
Combine similar categories written differently:
>“F” “FEMALE,” “female” → “Female” - Check for Logical Consistency
Clean data can still contain errors (e.g., birth years like 1890 or 2060). - Save and Document
Save the cleaned dataset separately (e.g., city_expenses_cleaned.csv).
Document all cleaning steps for transparency.
Imagine downloading a city’s 2025 spending table in Excel with the following issues:
Date |
Department |
Expense Item |
Amount |
12/01/24 |
Financial Affairs |
Cleaning Service |
25000 |
13.01.2024 |
FINANCIAL AFFAIRS |
CLEANING |
25.000,00 TL |
15/01/24 |
F.Affair |
Garbage Collection |
12.5 |
16/01/2024 |
Financialaffairs |
CLEANING SERVICE |
25,000 |
Example: Cleaning a City’s Expense Data
Problems:
- Mixed date formats.
- Department names are inconsistent.
- Amounts are formatted differently.
Cleaning Steps:
- Convert all dates to a single format.
- Standardize department names using OpenRefine’s “Cluster & Edit” → “Financial Affairs”
- Convert all amounts to a single numeric format.
After cleaning, the data is ready for analysis: categorize expenses, calculate totals, and visualize trends.
Leading Tools for Data Cleaning
Below you will find accessible and practical tools for journalists, along with their advantages:
It is one of the easiest tools for data cleaning. In a spreadsheet environment that almost everyone is familiar with, powerful cleaning operations can be performed with simple formulas and filters.
Uses: Deleting duplicate rows, correcting text formats, and standardizing dates.
Example:
=TRIM(A2) → Cleans unnecessary spaces in the cell.
=PROPER(A2) → Adjusts upper/lower case letters.
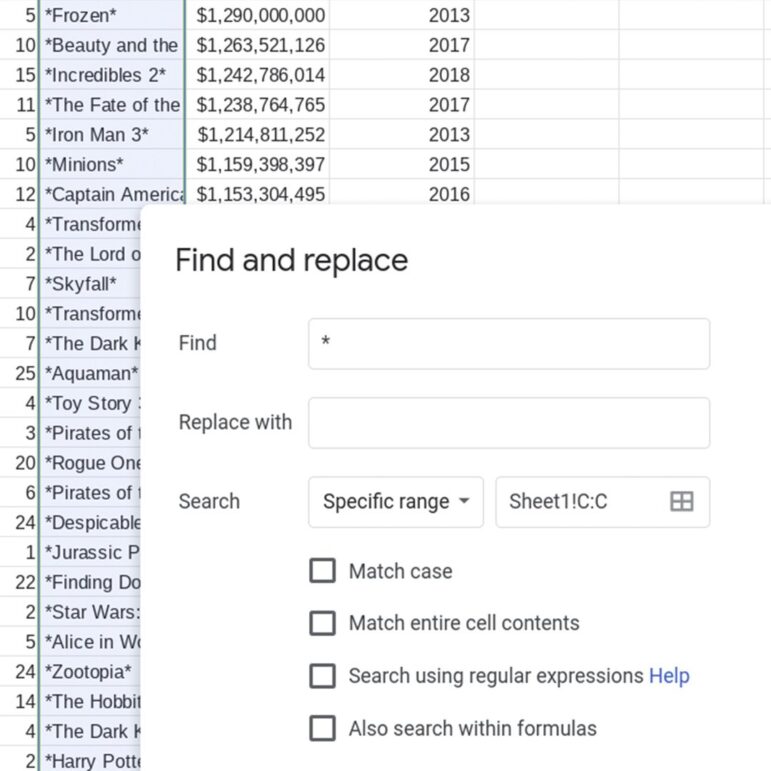
Image: Screenshot
The “Remove Duplicates” tool in the “Data” tab identifies repeating rows.
Advantage: Free, cloud-based, easy to share.
Disadvantage: May slow down with large data sets.
| An alternative GIJN article on the subject and my recordings, which are in Turkish but can be accessed using subtitles.
My Data Is Dirty! Basic Spreadsheet Cleaning Functions |
OpenRefine is the most widely used free data cleaning tool among data journalists. Formerly known as “Google Refine,” this open-source program can organize thousands of lines of data in seconds. I use it frequently in my classes.
- Uses: It allows you to merge duplicate records, normalize text formats, convert columns, and more.
- Standout feature: The “Cluster and Edit” feature automatically groups similar spellings.
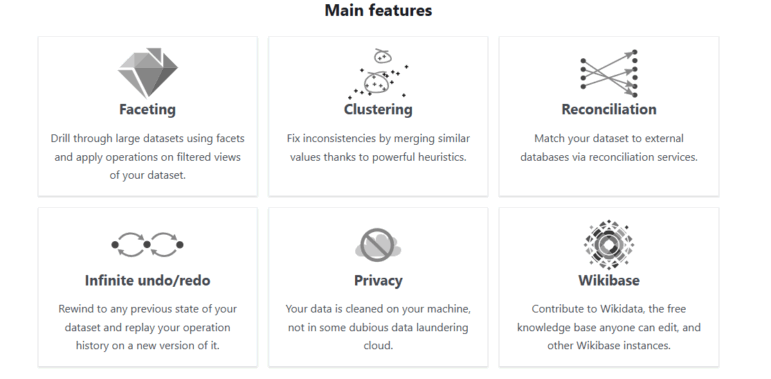
Image: Screenshot
For example, you can convert records like “Istanbul,” “İstanbul,” and “Ist” into a single standard format.
Data types: CSV, TSV, Excel, JSON, XML.
Advantage: Simplifies complex cleaning tasks and provides powerful filtering.
Disadvantage: Seems technical at first setup, but is easy to learn with a few examples.
| My training record, which is in Turkish but can be accessed using subtitles: |
Microsoft Excel’s “Power Query” add-in provides significant convenience for traditional Excel users.
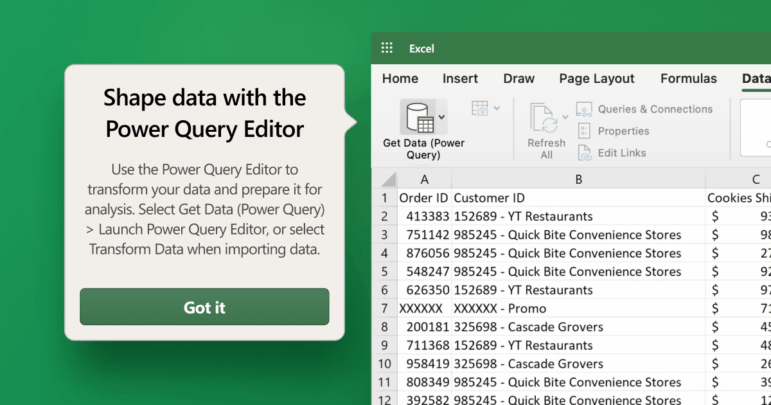
Image: Screenshot
- Usage: It allows you to perform operations such as merging multiple files, reformatting columns, and converting text.
- Feature: It records all operations, allowing you to automatically apply the same cleaning steps to new data.
Advantage: A natural transition for Excel users.
Disadvantage: Limited support in older versions, may require a paid license.
Learn to Automate Everything with Power Query in Excel
AirTable is a hybrid system between a spreadsheet and a database. Users can visually organize data, categorize it, and create related tables.
- Usage: Organizes source data, maintains data accuracy, and creates news tracking tables.
- Features: Filtering, color coding, linking (e.g., person-organization connections).
Advantages: Suitable for teamwork, aesthetically pleasing and intuitive.
Disadvantages: The free version has storage limitations.
How to set up automated data cleaning routines in Airtable
Trifacta Wrangler (Alteryx Cloud)
This is a powerful cleaning tool at the enterprise level. It provides AI-powered recommendations; it detects data errors itself and offers correction options.
Usage area: Cleaning large data sets, automatic conversion.
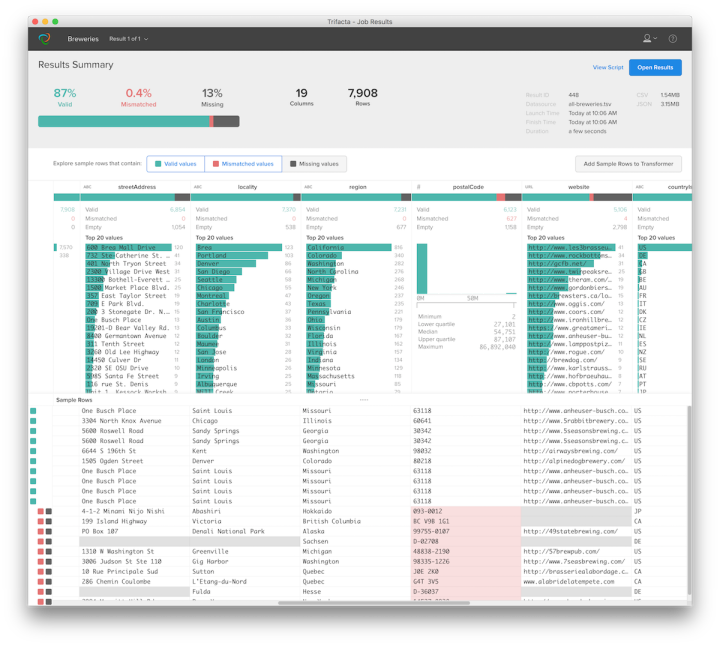
Image: Screenshot
Advantage: Saves time, supports complex data sources.
Disadvantage: Focused on the paid version, the interface is in English.
Tabula is a tool for liberating data tables locked inside PDF files. This is a common problem journalists face: public institutions sharing data in PDF format.
Tabula converts tables in PDF files to Excel or CSV format.
- Use case: Extracting tables from PDFs.
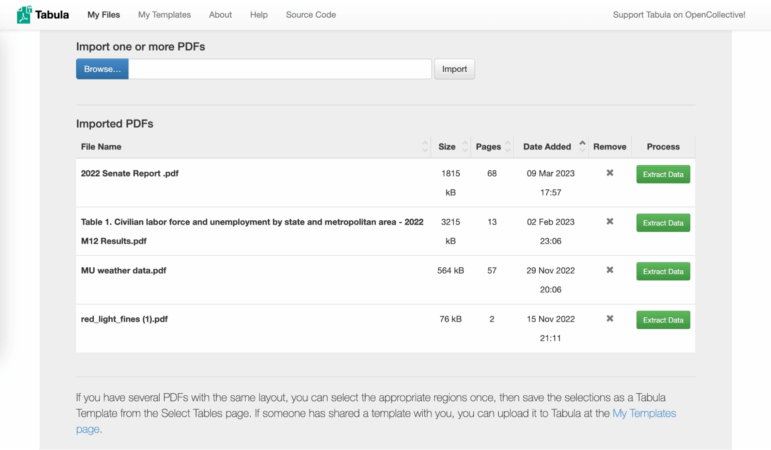
Image: Screenshot
Advantage: Free, open source.
Disadvantage: Errors may occur in complex or visual PDFs.
| My training record here: #1.2 Tabula ile PDF Dosyalarından Veri Kazıma |
Advanced Techniques in Code-Free Data Cleaning
Filtering and Conditional Cleaning
In Google Sheets or Excel, you can use “Conditional Formatting” to highlight abnormal values in color and quickly spot errors.
Formula-Based Automation
Cleaning can be automated using simple formulas instead of code:
- =UNIQUE(A:A) → Lists non-repeating values.
- =CLEAN(A2) → Removes invisible characters.
- =SUBSTITUTE(A2,“,”,“.”) → Corrects the difference between commas and periods.
Data Validation
In AirTable or Sheets, you can ensure that users only enter data in specific categories. This maintains consistency in the long term.
Best Practices and Ethics
Data cleaning is not just technical — it’s ethical. Journalists should maintain the original meaning while ensuring accuracy and consistency.
- Transparency: Note cleaning steps.
- Preserve Originals: Keep raw data.
- Reproducibility: Document steps so others can replicate your work.
- Don’t Guess: If a value is missing, mark it as “unknown.”
Data journalism and investigative reporting are not just about technical skills. Understanding, organizing, and validating data directly affects the accuracy of your stories. New tools make cleaning accessible to journalists without coding. Think of yourself as a storyteller, not an engineer — but remember: every strong story depends on solid data. With the right tools and methods, even non-coders can clean data and turn it into reliable news.
 Pinar Dag is the editor of GIJN Turkish and a lecturer at Kadir Has University. She is the co-founder of the Data Literacy Association (DLA), Data Journalism Platform Turkey, and DağMedya. She works on data literacy, open data, data visualization, and data journalism and has been organizing workshops on these issues since 2012. She is also on the jury of the Sigma Data Journalism Awards.

This work is licensed under a Creative Commons Attribution-NoDerivatives 4.0 International License
Republish our articles for free, online or in print, under a Creative Commons license.
Republish this article
This work is licensed under a Creative Commons Attribution-NoDerivatives 4.0 International License
Read Next

Data Journalism
Struck by Lightning: A Quick Lesson on Cleaning up Your Data
Being struck by lightning is often used as an example of heavenly retribution because it is so unlikely. Fatalities due to lightning are statistical outliers, since most people struck by lightning survive. So what is the best way to avoid becoming one of these outliers? The following is a step-by-step set of instructions for unpacking a dataset – and being careful about the conclusions we draw.

Resource Video
GIJC23 – Using Pinpoint to Organize Unstructured Data
Pinpoint is a powerful tool for converting unstructured data (text and other forms of messy data) into datasets that can be analyzed and used for stories.

Data Journalism Reporting Tools & Tips
Tips for Using Data in a Small Newsroom
Small newsrooms need to focus on the importance of data use more than ever — but they often face numerous hurdles, including a lack of funding and limited human resources.

Reporting Tools & Tips
Key Tools and Datasets for Unearthing Hard-to-Find Information
In a lightning round session at #GIJC21, a panel of leading reporters and editors needed just five minutes each to outline new tools and databases that any reporter can use to gather hard-to-find facts.