Tips on Where to Get Coronavirus Data — and the Tools to Analyze It
Read this article in
Organized crime is changing its trafficking routes, under the cover of COVID-19. Timber smugglers in the Amazon are boosting their trade in the absence of supervision. Unemployment and alcohol dependency rates are jumping, and climate change continues unabated.
The world is changing rapidly — and at almost every level — in the shadow of the coronavirus pandemic, says Giannina Segnini, director of the Data Journalism Program at Columbia University in the United States.
But Segnini says data and tools are available to investigate and analyze these changes, and that reporters can track many of these shifts in real time, including changes in behavior.
“Listen, your grandchildren will be talking about the pre- and post-COVID-19 era. We are definitely witnessing a historical situation here,” she said in a June 18 webinar, part of GIJN’s series Investigating the Pandemic. “This thing is just starting. There are so many things happening across borders that are not being monitored. But there is data to monitor what is happening, and never before has data been a better tool to make sense of the world around us.”
A co-founder of The Latin American Center for Investigative Journalism (CLIP, for its acronym in Spanish), Segnini and her data scientist colleague at CLIP, Rigoberto Carvajal, shared insights on finding new data sources to investigate this new world.
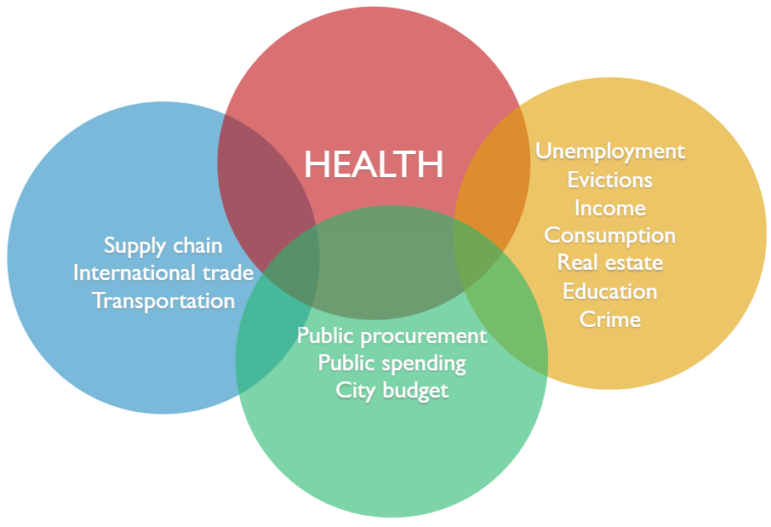
Beyond the direct health threats of COVID-19 and its fallout, Segnini said newsrooms could create data dashboards showing changes to ordinary life in their communities.
“Using automated data integration and standardized scales, you can imagine dashboards that reflect changes in variables like, say, traffic tickets, arrests, food prices, evictions,” she said. “All these changes are going to happen right away in society. And bad actors are taking advantage of the fact that we are all distracted by [the] coronavirus. Human trafficking and corruption is still happening, but they are changing routes and methods. There is destruction of supply chains. There are dramatic changes in shipping and airlines, with the travel restrictions.”

Although the numbers are fictitious in this mock-up, Segnini said newsrooms could create their own dashboards with data from “ordinary life” overlaid on COVID-19 case data to show the broader impacts. Image: Columbia University and CLIP
Segnini was previously head of the investigations unit at Costa Rica’s La Nación, and her team’s work led to the prosecution of more than 50 public figures, including three former presidents.
In his previous role with the International Consortium of Investigative Journalists, Carvajal was one of the data experts on the Panama Papers investigation.
Carvajal said COVID-19 case data provided by governments ranged from raw numbers and basic dashboards to downloadable, aggregated data — the most common form — and the best, but rarest, form: granular, case-by-case data. Within Latin America, he said, Mexico, Colombia, and Peru stood out as countries offering the richest case data.
“The best way to get rich visualization of knowledge from datasets is to mine granular data, with individual [anonymized] records for each patient [case],” said Carvajal.
He said it was important to use “ETL” programs (extract, transform, load) to automatically import that data into dashboards or visualizations because of its sheer volume. He uses an open source tool, Talend Open Studio, for data integration.
However, with COVID-19 data still unreliable in many countries, Segnini said mining excess mortality data remained a powerful technique for showing the pandemic’s broader impacts.
“Whether you have granular or aggregated data, we know that not all the cases are being counted — because many die at home, or they were not tested and the policy only [cites] positive-tested people, or because the reporting systems are inadequate or inaccurate,” she said. “Many are scared to go to hospitals, and could have died because they had complications. There is a methodology that allows you to calculate this excess mortality. You need to have data on all previous deaths during the same period of time in previous years. You can represent it by absolute numbers or as a percentage. The more previous years you have, the better the calculation.”
She said the emergence of mobility data — where personal mobile phone signals can be anonymized and aggregated — represented a powerful new tool for describing rapid change.
Data Tools Recommended by Carvajal and Segnini
- Mobility data: Google COVID-19 Community Mobility Reports chart population movement trends in response to COVID-19 policies. The COVID-19 Mobility Data Network is a group of epidemiologists who use anonymized data from mobile phone and tech companies to track behavior.
- Mobility analysis: Using requests for directions on Apple Maps, Apple creates movement reports while preserving individual privacy in its Apple Mobility Trends Reports. A catalog that simplifies geospatial analysis of people movement is Descartes Labs Platform.
- Open source data integration tools, like Talend Open Studio. Automated download and integration is essential for many pandemic-related dashboards and visualizations.

Image: Columbia University and CLIP
- Country and region-specific COVID-19 case tools: For the US, try 1Point3Acres and The Covid Tracking Project. For reliable data on China, try Ding Xiang Yuan. For data from multiple sources on pandemic impacts in Africa, use ONE Africa COVID-19 Tracker and the Africa COVID-19 Tracker. For excess mortality data for Europe, try EuroMOMO. For updated excess mortality comparisons, particularly for Western countries, try The Human Mortality Database.
- Specialist database tools: For data on medical details, like symptoms, travel history, and chronic disease, try the Kaggle Novel Coronavirus Dataset. For data on race and COVID-19 in the US, try the COVID Racial Data Tracker.
- International trade and supply chain sources: For open source data, try the UN Comtrade Database. For commercial try Panjiva, Datamyne, or ImportGenius.
 Rowan Philp is a reporter for GIJN. Rowan was formerly chief reporter for South Africa’s Sunday Times. As a foreign correspondent, he has reported on news, politics, corruption, and conflict from more than two dozen countries around the world.

No Coding Required: A Step-by-Step Guide to Scraping Websites With Data Miner

Free, Game-Changing Data Extraction Tools that Require No Coding Skills

Tipsheet: Latest Tools for Investigating with Telegram

Investigating Elections: Threat from AI Audio Deepfakes

Data-Driven Journalism: Roundup of Recent Standout Stories
No Coding Required: A Step-by-Step Guide to Scraping Websites With Data Miner
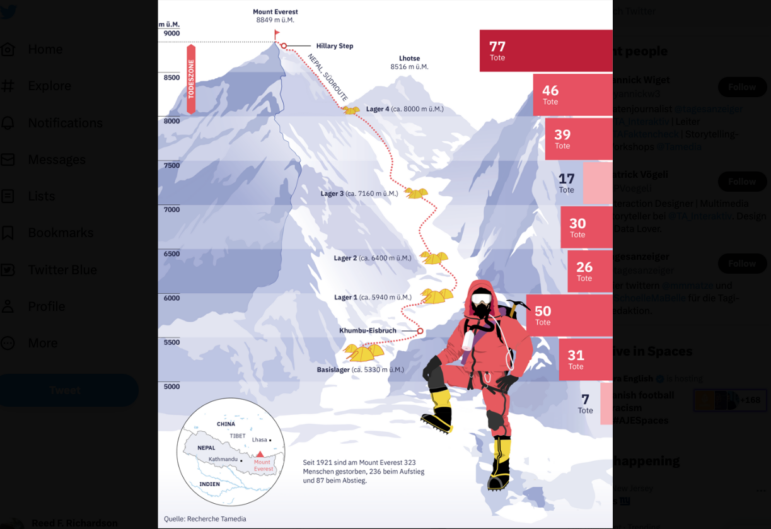
Data Journalism Top 10: Everest’s Deadly Legacy, Paris Metro Pollution, Migrant Worker Struggles in Singapore
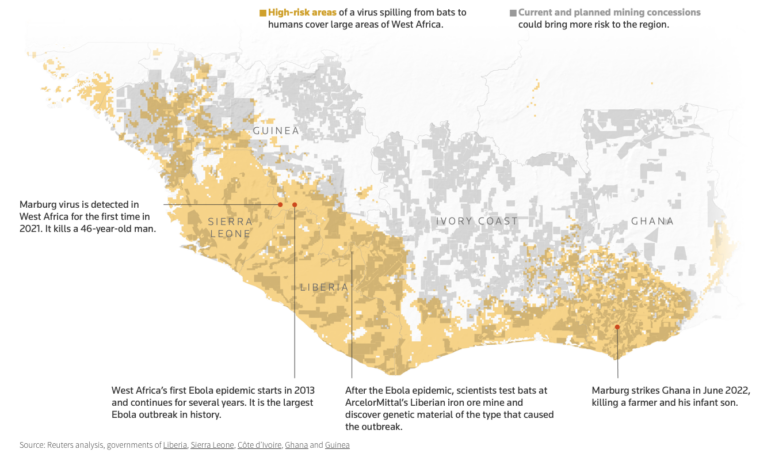
Data Journalism Top 10: Bats and the Next Pandemic, China’s Electric Battery Dominance, and Brazil’s Healthcare ‘Holes’

This work is licensed under a Creative Commons Attribution-NoDerivatives 4.0 International License
Republish our articles for free, online or in print, under a Creative Commons license.
Republish this article
This work is licensed under a Creative Commons Attribution-NoDerivatives 4.0 International License
Read Next
Case Studies Data Journalism GIJC23
Data-Driven Journalism: Roundup of Recent Standout Stories
The best of modern data journalism tells powerful stories that test assumptions. At GIJC23, two experts discussed strong recent investigations and what makes them stand out.
Tipsheet Data Journalism GIJC23
No Coding Required: A Step-by-Step Guide to Scraping Websites With Data Miner
Knowing where to look for data — and accessing it via scraping data from websites — can be a powerful force multiplier for investigative journalists.
Data Journalism Data Journalism Top 10
Data Journalism Top 10: Everest’s Deadly Legacy, Paris Metro Pollution, Migrant Worker Struggles in Singapore
This week, GIJN’s Top 10 in Data Journalism examines why the world’s tallest mountain has become increasingly deadly for those trying to climb it, pollution in Paris metro stations, US laws expanding gun access one year after the Uvalde mass shooting, and migrant worker struggles in Singapore.
Data Journalism Data Journalism Top 10
Data Journalism Top 10: Bats and the Next Pandemic, China’s Electric Battery Dominance, and Brazil’s Healthcare ‘Holes’
GIJN’s weekly, curated look at the Top 10 in Data Journalism highlights bats and predicting the location of the next pandemic, China’s electric battery dominance, and mapping out Brazil’s healthcare “holes.”