GIJN’s Data Journalism Top 10: Populism Quiz, EU Fact-Checking, Twitter Data, GitHub 101


What’s the global data journalism community tweeting about this week? Our NodeXL #ddj mapping from March 18 to 24 finds a collection of beautiful news graphics by Megan Jaegerman curated by @EdwardTufte, @tagesanzeiger‘s quiz testing readers’ populist leanings, new collaborative fact-checking by @FactcheckEU, and @briromer‘s piece on maps that break strict geography rules.
Beautiful News Graphics
Data viz guru Edward Tufte praises the beauty of Megan Jaegerman’s finely detailed, inventive and informative news graphics for The New York Times from 1990 to 1998. Among his choice picks is a depiction of tell-tale signs that an individual is concealing a gun, based on a New York City cop’s observations.
Populism Quiz
How populist are you? Tages-Anzeiger created a Populism Quiz with 20 questions to gauge where people fall on the populist spectrum. Almost 100,000 people took part in the quiz over 10 days, and two-thirds of the participants turned out to be populists.
Do Basketball Prodigies = NBA Success?
How many high school basketball prodigies actually make it to superstar status in the NBA? The Pudding analyzed the careers of the top 100 high school recruits in the past 20 years to find out. It also took a look at the colleges who recruit the most promising high school players to see how many yield NBA talent.
Fact-Checking Europe
Hoaxes and misleading information are not limited to a nation’s borders. In light of this, 19 news organizations in Europe launched FactCheckEU to combat misinformation and separate fact from fiction ahead of Europe’s parliamentary elections in May. More on the effort here.
GitHub 101
GitHub is the go-to-place for newsrooms and data journalists to publish their code or data behind a story or project. But just how is it used? The Financial Times’ newsroom developer Max Harlow provides the skinny on the platform, the jargon and how to collaborate using GitHub.
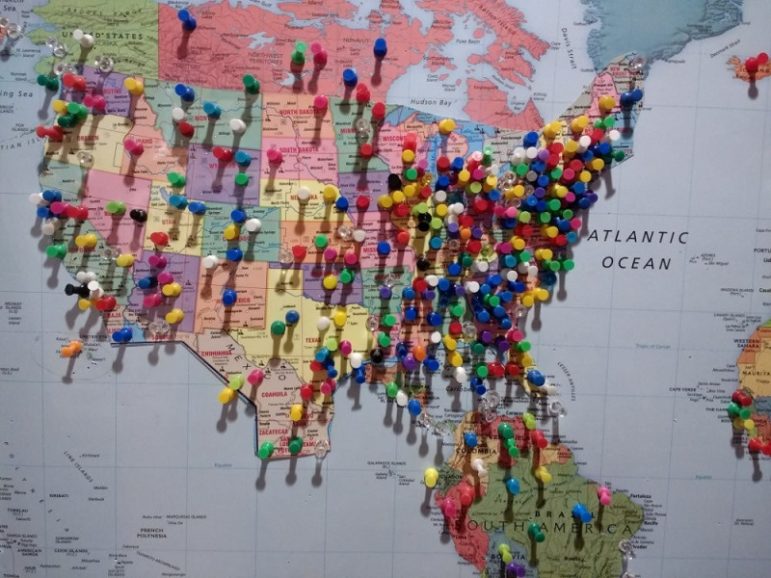
Mapbreaking
Brian Romer examines the emotional resonance and factual distortion of geographic maps. He lists examples of masterful map designs that go beyond the rules of strict geography.
Journocode Tools Collection
Journocode curated a collection of close to 40 tools for all your data journalism needs, categorized by purpose, platform and cost. Tools marked with a golden acorn are some of the team’s favorites; these include Mapbox, OpenRefine and Tabula.
Practical R for Journalism
“Every journalist who is serious about working with data at some point will run into the limits of Excel and will have to decide what to do,” says Sharon Machlis, author of the book “Practical R for Mass Communication and Journalism.” She spoke with Storybench about coaxing power Excel users into the next level of their data work with her book on R.
Garbage Collection Frequency
To boost recycling rates, a majority of the city councils in the United Kingdom have already switched to fortnightly garbage collection rounds or are planning to do so. The BBC has the data on the councils’ garbage collection frequency, daily household waste and recycling rates in the United Kingdom.
Working With Twitter Data
Twitter is increasingly becoming politicians’ choice mode of communication with their supporters, so it is important for journalists to keep a record of their tweets. Here’s an R package by Michael Kearney to help you start collecting and analyzing Twitter data.
Thanks, once again, to Marc Smith of Connected Action for gathering the links and graphing them.
 Eunice Au is GIJN’s program coordinator. Previously, she was a Malaysia correspondent for Singapore’s The Straits Times, and a journalist at the New Straits Times. She has also written for The Sun, Malaysian Today and Madam Chair.
For a look at Marc Smith’s mapping on #ddj on Twitter, check out this map.


This work is licensed under a Creative Commons Attribution-NoDerivatives 4.0 International License
Republish our articles for free, online or in print, under a Creative Commons license.
Republish this article
This work is licensed under a Creative Commons Attribution-NoDerivatives 4.0 International License
Read Next

Data Journalism News & Analysis
From Space to Story in Data Journalism
Over the past 10 years satellite imagery has become an important component of data journalism. In the next 10, it will likely evolve further, from a tool used primarily for illustrating stories to an integral part of research and investigative reporting.

Data Journalism
10 Outstanding Data Projects Win the 2024 Sigma Awards
There were 52 data journalism entries from 22 countries in shortlist for the 2024 Sigma Awards. Here are the top 10 winning projects.
Data Journalism Methodology
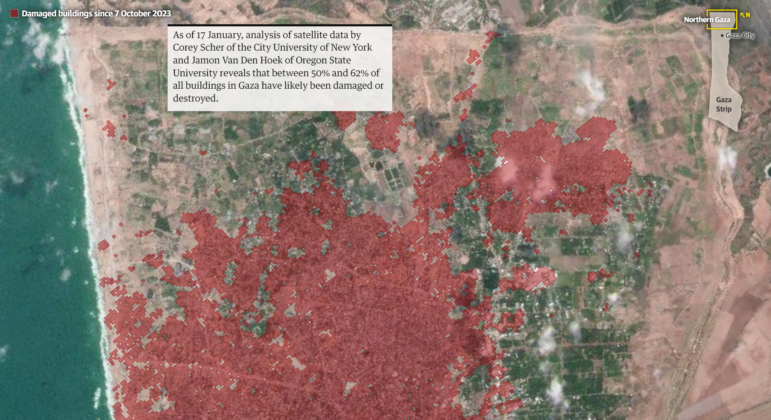
Mapping Conflict: Using Satellite Radar Data to Track the War Damage in Gaza
Gaza’s urban landscape has changed profoundly since the start of Israel’s military campaign. Researchers Jamon Van Den Hoek and Corey Scher have been mapping the impact.

Data Journalism Data Journalism Top 10
Trump’s Disappearing Donors, Tracking the Mars Rover, and the Ongoing Wars in Gaza and Ukraine
Our column of the best in data journalism also features stories on AI’s ability to forecast the weather, analyzing the Argentine president’s Tweetstorms, and apathetic EU voters.