Top Ten #DDJ: This Week’s Top Data Journalism


What’s the global #ddj community tweeting about? Our NodeXL analysis from July 17 to 23 has @ajc intern @stephanierlamm mapping closed data, @zeitonline mapping the path of voluntary rescue boats in the Mediterranean Sea, and @PPLAFF on the corruption scandal around Democratic Republic of the Congo President Joseph Kabila.
Mapping Closed Data
The Atlanta Journal-Constitution requested public data on how many affordable housing units had been built, funded or planned along the Beltline corridor but reporters didn’t get satisfactory answers. AJC intern Stephanie Lamm wouldn’t give up. Within 15 hours, Lamm mapped where housing was funded using open source tools that she had never used before.
Here’s how a journalist in Atlanta mapped closed data for accountability https://t.co/fGiJnzwXVq #ddj #opengov pic.twitter.com/yj7cU5NNfI
— Sunlight Foundation (@SunFoundation) July 19, 2017
The Lumumba Papers
The Lumumba Papers platform, by Platform for the Protection of Whistleblowers in Africa (PPLAAF), details the chronology of events of a controversial corruption scandal surrounding the administration of Joseph Kabila, President of the Democratic Republic of the Congo.
⚡️The #LumumbaPapers #YaMbalaOyoEkoki #CongoCrisis
Comment KABILA, famille et “amis” s’enrichissent illicitement ??https://t.co/EwsERzBmOc pic.twitter.com/uqDHrEXP64— #LePaysVaTresMal?? (@kinshasaweb) July 17, 2017
DataViz: Refugee Sea Rescue
Zeit Online took a data-driven look into the rescue operations of refugees in the Mediterranean Sea. The paths of voluntary rescue boats are presented in an interactive graphic and heatmap.
NGO boats rescuing #refugees mostly stay outside Libya’s 12-mile-zone. See our #dataviz based on AIS tracking data: https://t.co/TZWRE1cUBf pic.twitter.com/ZidPfCKfe4
— Sascha Venohr (@venohr) July 20, 2017
Mapping Italy’s Fires
GB Vitrano maps fires that occur in Italy, using data provided by the project EFFIS — the European Forest Fire Information System. Each marker on the map shows the location, day of the report and a link to the news that describes it.
La #mappa con le news sugli #incendi nel 2017 realizzata da @gbvitrano. In nero gli incendi degli ultimi 7 giorni https://t.co/1RQB43iCbm pic.twitter.com/HZ2xRH96Nu
— italiaafuoco (@italiaafuoco) July 18, 2017
Berlin’s Tram Line
Cool data visualization by Berliner Morgenpost of Berlin’s 250 public transport lines, enriched with social and economic statistics along each line, such as availability of clubs, amount of bicycle thefts and average home rental prices.
That’s what happens if you plot data against tram / underground stops. https://t.co/eMKCArvSfG pic.twitter.com/4VlmiHziE7
— Smashing Magazine (@smashingmag) July 18, 2017
Asylum at a Glance
SRF Data presents the most important developments of the asylum situation in Switzerland in easy-to-understand graphics. It includes the number of asylum applications, the origin of applicants and the percentage of applications granted or rejected.
Daten statt Emotionen: Das Asyl-Dashboard aktualisiert sich automatisch mit den neusten Zahlen https://t.co/iuI5bvCRqj #ddj pic.twitter.com/Dy5hQmN8Ru
— SRF Data (@srfdata) July 19, 2017
Africa Open Data Conference
The official press launch of the Africa Open Data Conference in Accra, Ghana.
Open Data Camp UK
Open Data Camp 5, an “unconference” entirely devoted to open data, will be held on October 21 and 22 at Queen’s University Belfast, Northern Ireland.
Here we go 🙂 Announcing #OpenData Camp 5 https://t.co/WChY1Uenf4 #ODCamp
— Open Data Camp UK (@ODcamp) July 17, 2017
Data Journalism: A Civic Duty
Data journalism trainer Eva Constantaras explains why all data journalism produced should have a public interest and purpose.
Why data journalism is a civic duty in developing countries https://t.co/IUWPvuBIAU
— Journalism.co.uk (@journalismnews) July 18, 2017
R Packages for Visualization
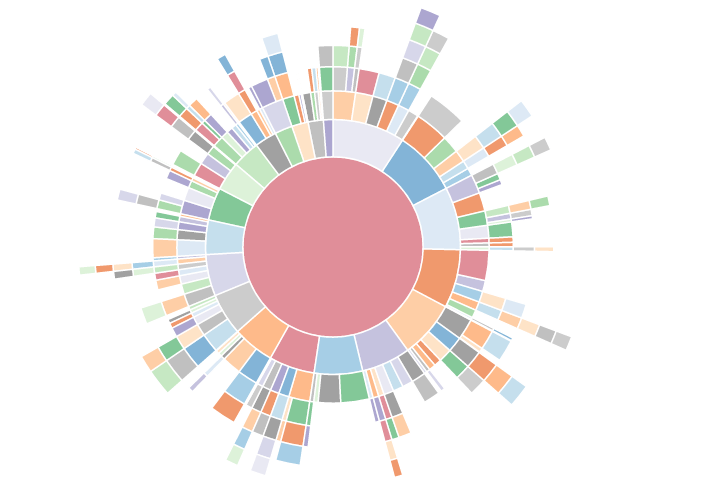
Antoine Guillot curates a list of the best packages for interactive and complex visualizations, including NetworkD3, visNetwork and SunburstR.
ICYMI, feat. lots o’ @timelyportfolio: “A pick of best R ?s for interactive viz” by @AntGuilllot https://t.co/6sgT7u5ofx #rstats #dataviz pic.twitter.com/22XCgmugRF
— Mara Averick (@dataandme) July 15, 2017
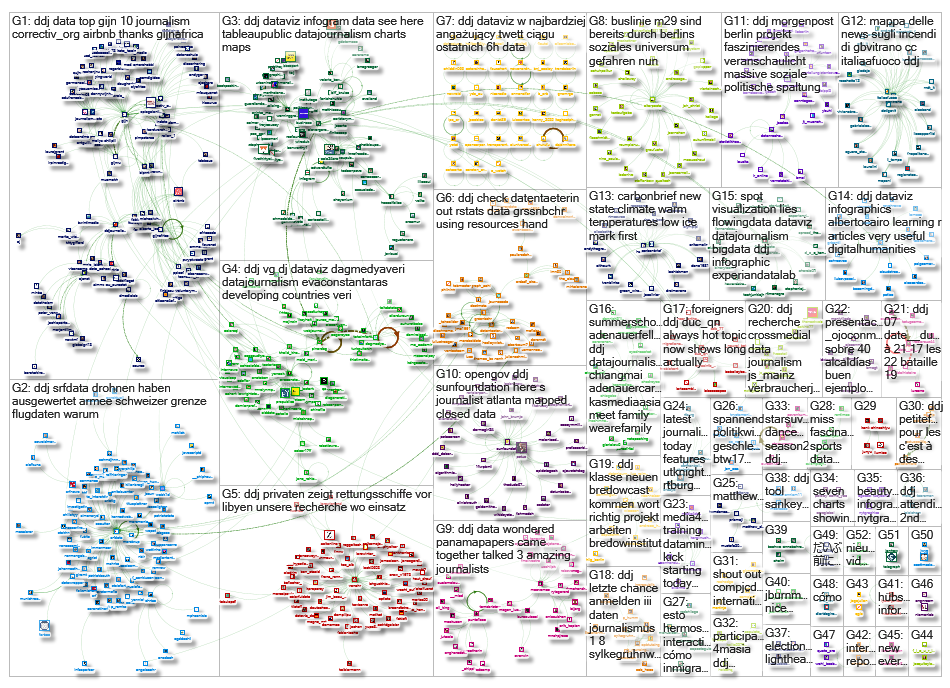
Thanks, once again, to Marc Smith of Connected Action for gathering the links and graphing them.
For a look at Marc Smith’s mapping on #ddj on Twitter, check out this map.

This work is licensed under a Creative Commons Attribution-NoDerivatives 4.0 International License
Republish our articles for free, online or in print, under a Creative Commons license.
Republish this article
This work is licensed under a Creative Commons Attribution-NoDerivatives 4.0 International License
Read Next

Data Journalism News & Analysis
From Space to Story in Data Journalism
Over the past 10 years satellite imagery has become an important component of data journalism. In the next 10, it will likely evolve further, from a tool used primarily for illustrating stories to an integral part of research and investigative reporting.

Data Journalism
10 Outstanding Data Projects Win the 2024 Sigma Awards
There were 52 data journalism entries from 22 countries in shortlist for the 2024 Sigma Awards. Here are the top 10 winning projects.

Data Journalism Data Journalism Top 10
Trump’s Disappearing Donors, Tracking the Mars Rover, and the Ongoing Wars in Gaza and Ukraine
Our column of the best in data journalism also features stories on AI’s ability to forecast the weather, analyzing the Argentine president’s Tweetstorms, and apathetic EU voters.

Data Journalism
Updating the Inverted Pyramid of Data Journalism
Data journalist and instructor Paul Bradshaw has updated the Inverted Pyramid of Data Journalism — and brought together resources for every stage.