
Top Ten #ddj: This Week’s Top Data Journalism
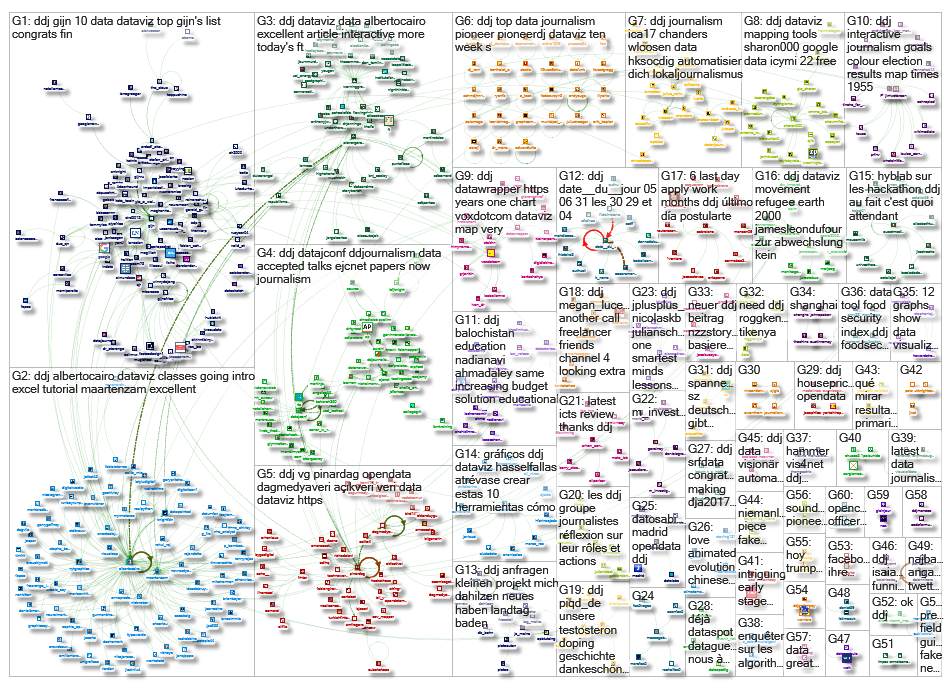
 What’s the #ddj community tweeting about? Our NodeXL mapping from May 29 to June 4 features research on social media propaganda from @ddjournalism, mapping global refugee flow from @FastCompany and the tax bracket racket from @voxdotcom.
Propaganda on Social Media
Research by the University of Copenhagen’s Johan Farkas and Jannick Schou highlights the potential effectiveness and destructiveness of disguised propaganda in social media, triggering even more questions. How widespread are these practices? And how can we find better ways of identifying fake identities and their authors?
How researchers collected data from #Facebook to uncover fake Islamist propaganda: https://t.co/Eml1Y75otk @ejcnet #ddj pic.twitter.com/UWlOtFwOQZ
— DataDrivenJournalism (@ddjournalism) May 29, 2017
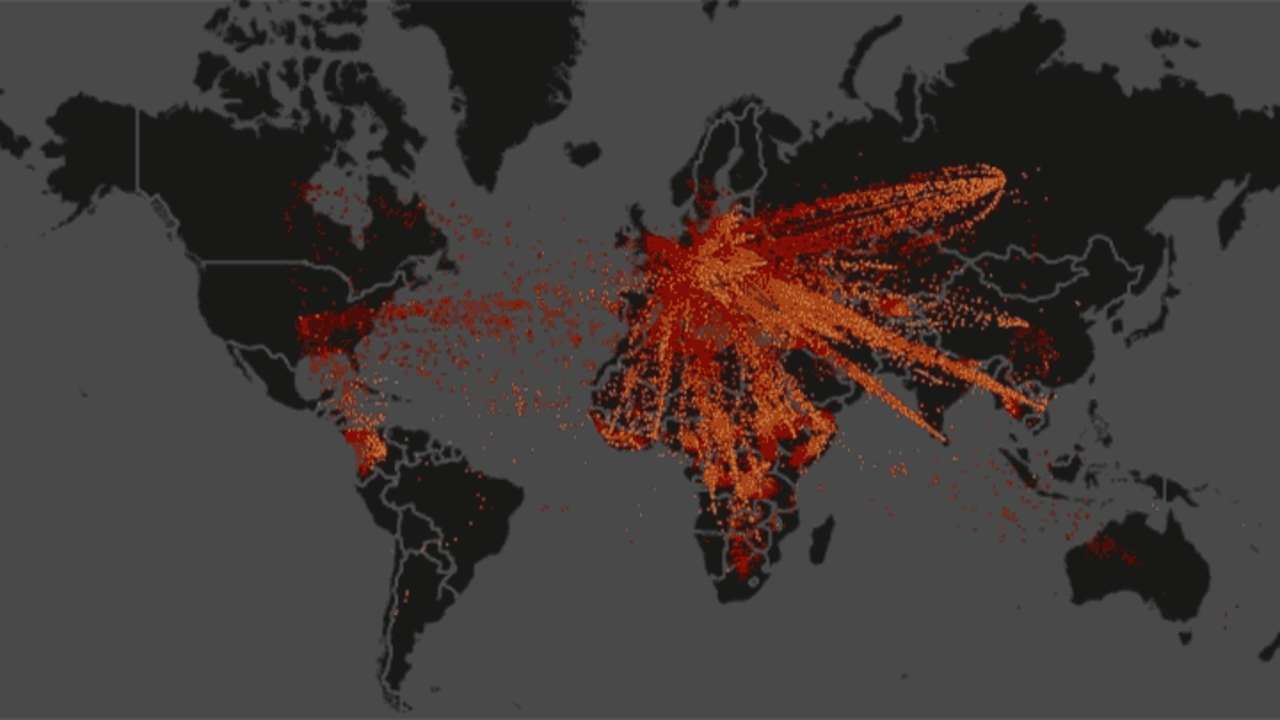
Mapping Global Refugees
Watch Fast Company‘s mesmerizing data visualization of the movement of refugees worldwide since 2000.
Where are most of the world’s refugees going? This data visualization shows that most flee to neighboring countries.https://t.co/W0JyudXMio pic.twitter.com/Co4XraTlmo
— UNHCR United States (@UNHCRUSA) June 5, 2017
Unsteady Jobs
Workers in America’s gig economy experience income swings as the number of hours they work changes from week to week, according to The New York Times. And the middle class is not immune.
A reliable job no longer delivers reliable pay. “Only households that earn $105,000 or more a year are secure” https://t.co/CYH22lvTjk pic.twitter.com/RDoLG7AUD8
— NYT Business (@nytimesbusiness) June 6, 2017
Free Data Viz, Analysis Tools
Got data? Computerworld compiled a list of 22 useful tools that can help you turn your data into informative, engaging graphics.
Great tools for student data analysis!!! 22 free tools for data visualization and analysis #UDL #edtech https://t.co/mGxFuriXlg pic.twitter.com/1ZpsiC7Rtm
— Katie Novak (@KatieNovakUDL) May 30, 2017
10 Charting Tools
La Data Cuenta on creating charts using Infogram, Fusion Tables, Datawrapper and more.
Atrévase a crear gráficos con estas 10 herramientas https://t.co/8AHofTsrry pic.twitter.com/FDSV8PMjGQ
— Hassel Fallas (@HasselFallas) May 31, 2017
100 Years of Taxation
US politicians want to reduce the number of tax brackets because they say it will simplify the tax code. In one chart, Vox plainly illustrates how the changing US tax brackets impacted on income inequality in the post-Reagan era.
Very engaging interactive: 100 years of tax brackets in one chart – https://t.co/GWk7ygOzJO via @voxdotcom #dataviz #ddj pic.twitter.com/QGvRYcf4fn
— Steffen Kühne (@stekhn) May 29, 2017
Free #ddj Courses
Three free courses on Learno include “Going Viral Using Social Media Analytics” taught by Stijn Debrouwere, “Cleaning Data in Excel” by Maarten Lambrechts and “Mistakes We Made So You Don’t Have To: Data Visualization, Journalism and the Web” by Jonathon Berlin.
Expand your #ddj skill set with @ejcnet and @learnonet‘s free new course offerings: https://t.co/V8HNwzT5Z0 pic.twitter.com/NHmUCjqFPS
— DataDrivenJournalism (@ddjournalism) May 28, 2017
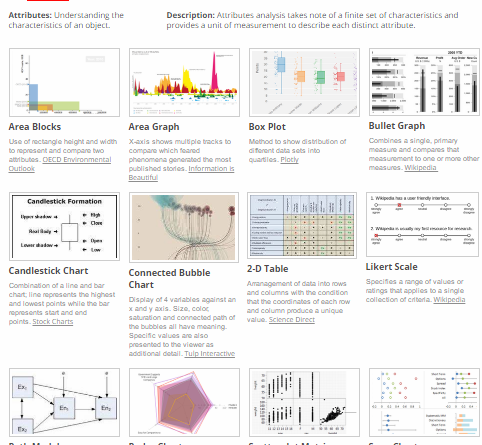
Data Journalism Library
The data visualization library provides a comprehensive collection of data visualization, descriptions and resource links to learn more about visualization techniques.
AP Stylebook Gets Data
The AP Stylebook now includes guidelines on data: requesting it, scraping it, reporting on it and publishing it.
An interesting update to AP Styleguide about web scraping and data handling. What do you think, data journos? https://t.co/fNKsNPHSxW pic.twitter.com/2hAM6xHQ34
— Mick Côté (@MickCote) May 31, 2017
European Data Conference
The conference in Dublin on July 6 and 7 will look at the global state of data journalism, leveraging search data to bring elections to life and data journalism as a civic duty.
Check out our line up on https://t.co/MFDqnZXK83. #ddj
— DataJ Conf (@datajconf) June 2, 2017
Thanks, once again, to Marc Smith of Connected Action for gathering the links and graphing them.
For a look at Marc Smith’s mapping on #ddj on Twitter, check out this map.

Document of the Day: Visual Vocabulary

Tipsheet: Latest Tools for Investigating with Telegram

Investigating Elections: Threat from AI Audio Deepfakes

Updated GIJN Databases (Poverty, Crime, Corruption, and Terrorism)
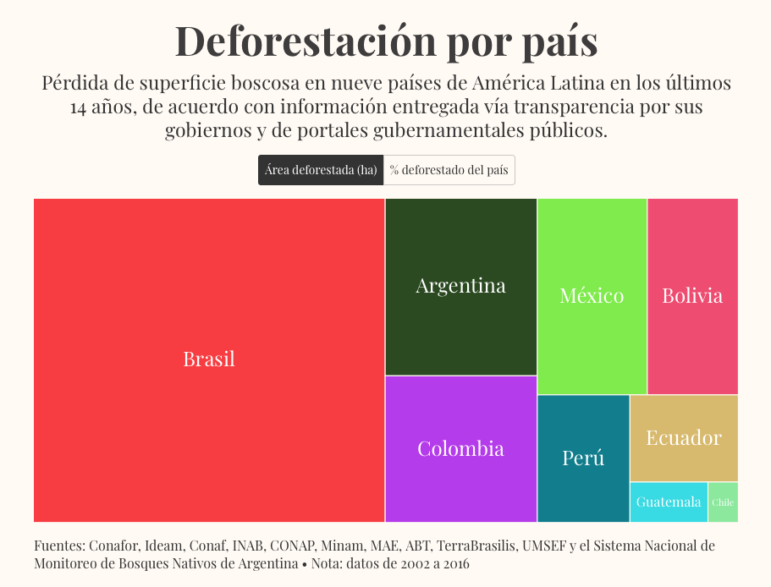
Data Journalism Top 10: Latin America Deforestation, Twitter Censorship, and Bankrupt Coal Mines’ Toxic Legacy
Data Journalism Top 10: Abortion Pill Access, India Surpasses China, Pandemic Pets Boom
Data Journalism Top 10: Rise of Omicron, Africa’s Growing Cities, Tech’s Glass Ceiling, and Honeybees Self-Quarantining
Why Dynamic Data Visualization Is Key to Covering Climate Change

This work is licensed under a Creative Commons Attribution-NoDerivatives 4.0 International License
Republish our articles for free, online or in print, under a Creative Commons license.
Republish this article
This work is licensed under a Creative Commons Attribution-NoDerivatives 4.0 International License
Read Next
Data Journalism Data Journalism Top 10
Data Journalism Top 10: Latin America Deforestation, Twitter Censorship, and Bankrupt Coal Mines’ Toxic Legacy
In this week’s Top 10 in Data Journalism, GIJN looks into stories about Latin American deforestation, Twitter’s censorship compliance, and the toxic legacy of bankrupt coal mines in the US.
Data Journalism Data Journalism Top 10
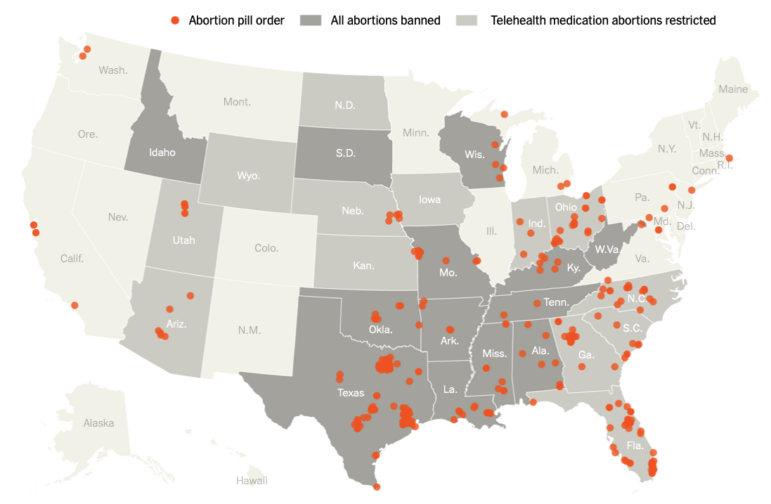
Data Journalism Top 10: Abortion Pill Access, India Surpasses China, Pandemic Pets Boom
This week’s data journalism roundup digs into abortion pill access in the US, India’s population surpassing China, the illusion of reforestation as a solution for climate change, and the boom in owning pets during the pandemic.
Data Journalism
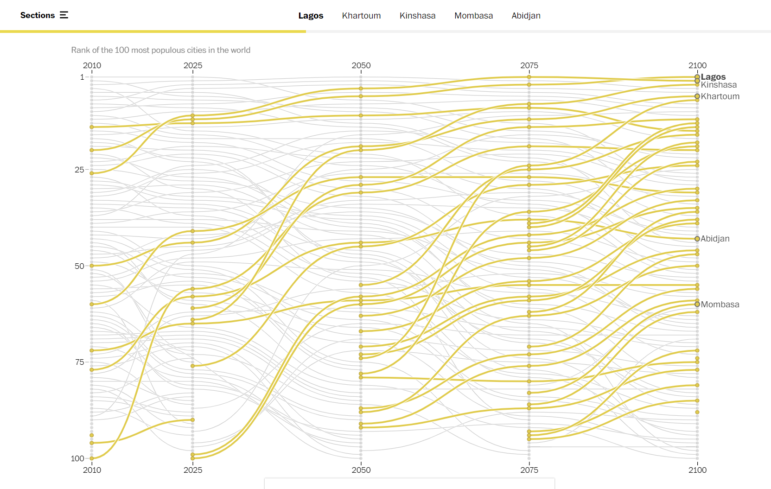
Data Journalism Top 10: Rise of Omicron, Africa’s Growing Cities, Tech’s Glass Ceiling, and Honeybees Self-Quarantining
Our weekly analysis of the most popular data journalism stories on Twitter highlights a story by Spanish newspaper El País analyzing early data on the omicron variant, plus stories on fake news and disinformation in Thailand, climate data, and a story on how artificial intelligence can judge your music taste.
Data Journalism
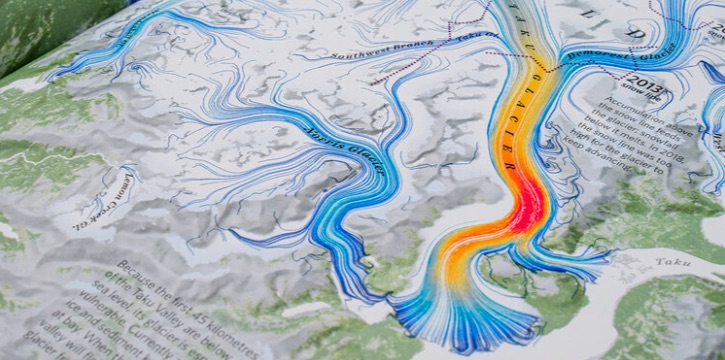
Why Dynamic Data Visualization Is Key to Covering Climate Change
As calls for change grow louder in light of the latest IPCC (Intergovernmental Panel on Climate Change) report and in the run up to COP26 conference in Glasgow this November, it’s time to focus on how data visualization can help people grasp the challenges that lie ahead.