Accessibility Settings

color options

monochrome muted color dark

reading tools

isolation ruler

Tag

R

13 posts

Data Journalism

My Favorite Tools with Al Jazeera’s Mohammed Haddad

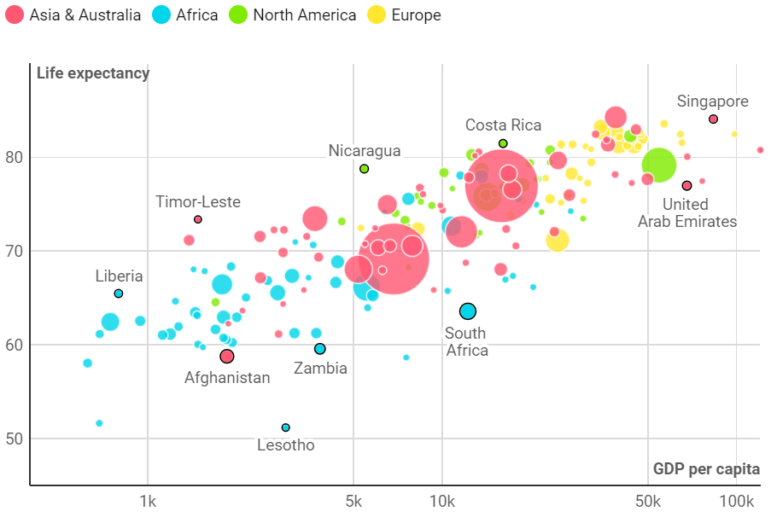
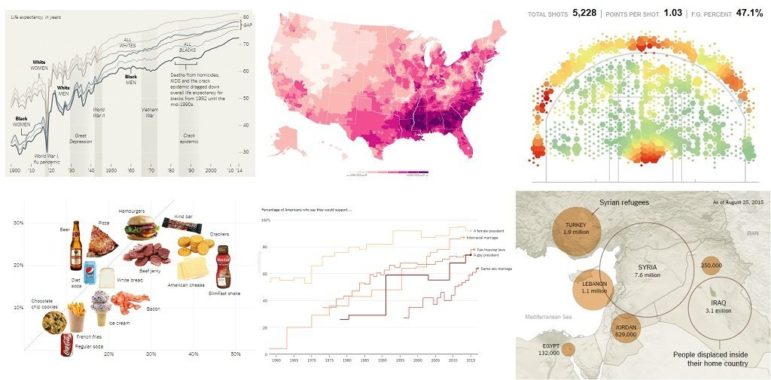
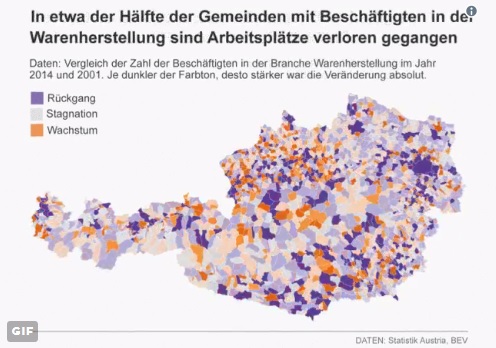
In this edition of our “My Favorite Tools” series, GIJN spoke with Mohammed Haddad, who leads Al Jazeera’s interactive team, AJLabs, where he uses data to create compelling visual stories. Haddad explains why he is a fan of RStudio, Nivo, Mapbox, and more.

Data Journalism

My Favorite Tools: Alberto Cairo on Data Visualization

For our series on journalists’ favorite tools, we spoke to Alberto Cairo, head of visualization at the University of Miami’s Institute for Data Science and Computing. Cairo shared several user-friendly tools and core principles to help investigative reporters shape their data visually to create new insights for audiences.

Reporting Tools & Tips

How to Build a GIF of Satellite Imagery in R

Sometimes, the best way to tell a story is to take a bird’s eye view. Here’s how Storybench editor Aleszu Bajak did this by recreating a GIF of Chennai’s disappearing Lake Puzhal reservoir. Check out his process and code, which could be used for countless other animations — to show, say, dam collapses, deforestation, forest fires, and more.

Data Journalism

This Week’s Top Ten in Data Journalism

What’s the global data journalism community tweeting about this week? Our NodeXL #ddj mapping from October 9 to 15 has @RTSinfo looking into flight sharing platform @Wingly_UK, while @srfdata finds millions of fake @instagram followers, @jwyg charts the growth of all Internet sites, and @nytimes collaborates with @AmstatNews to promote critical thinking and data literacy.

Data Journalism

Data Journalism’s Top Ten

What’s the global data journalism community tweeting about this week? Our NodeXL #ddj mapping from August 14 to 20 has @Forbes mapping six years of American television news, the looming Kantar @infobeautyaward’s submission deadline and @sarahslo’s list of women in the field of data visualization.

Data Journalism

Top Ten #ddj: This Week’s Top Data Journalism

What’s the #ddj community tweeting about? Our NodeXL mapping from May 22 to 28 includes what it’s like to code as a journalist from @CJR, artists and designers visualizing Google search data from @FastCoDesign, the Data Journalism Awards 2017 shortlist from @mberzosa and Austria’s changing job market from @derStandardat.

Data Journalism

Top Ten #ddj: The Week’s Most Popular Data Journalism Links

Here are top data journalism tweets for Apr 17-23, per our NodeXL mapping: French voting (@lamontagne_fr); music festival gender (@pitchfork); mapping US homeless (@FastCompany); Scottish fact checking (@FerretScot); Spanish voting (@Politibot). tilegrams (@bhaskar_vk); & more.

Case Studies

How Univision Revealed Flaws in Costa Rica’s Judicial System

Four years of work and 8,000 judicial rulings later, the team at Univision Data shows how in Costa Rica, a person is more likely to be convicted of a crime if they are assigned a public defense attorney than if they have a private one. Their methodology included web scraping, R and logistic regression — a statistical method common in social sciences but practically unexplored in newsrooms.