Accessibility Settings

color options

monochrome muted color dark

reading tools

isolation ruler

Tag

interactive map

6 posts

Data Journalism

Top Ten #ddj: This Week’s Top Data Journalism

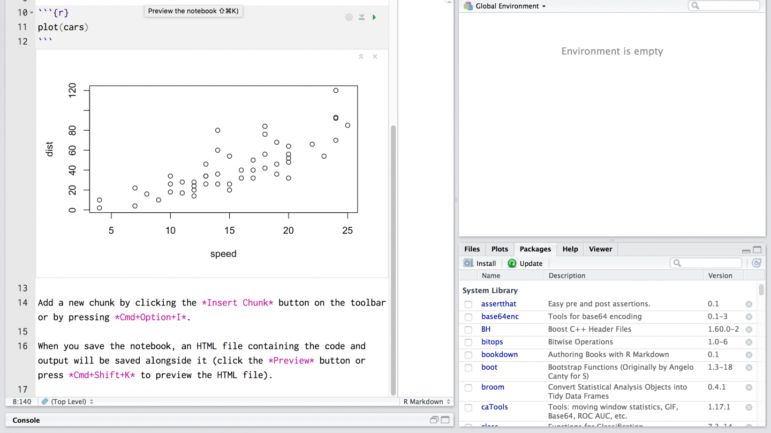
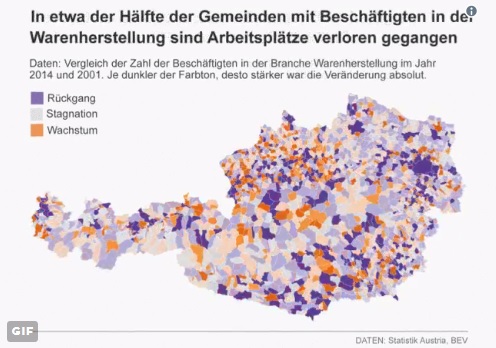
What’s the #ddj community tweeting about? Our NodeXL mapping from May 22 to 28 includes what it’s like to code as a journalist from @CJR, artists and designers visualizing Google search data from @FastCoDesign, the Data Journalism Awards 2017 shortlist from @mberzosa and Austria’s changing job market from @derStandardat.

Data Journalism

Top Ten #ddj: The Week’s Most Popular Data Journalism Links

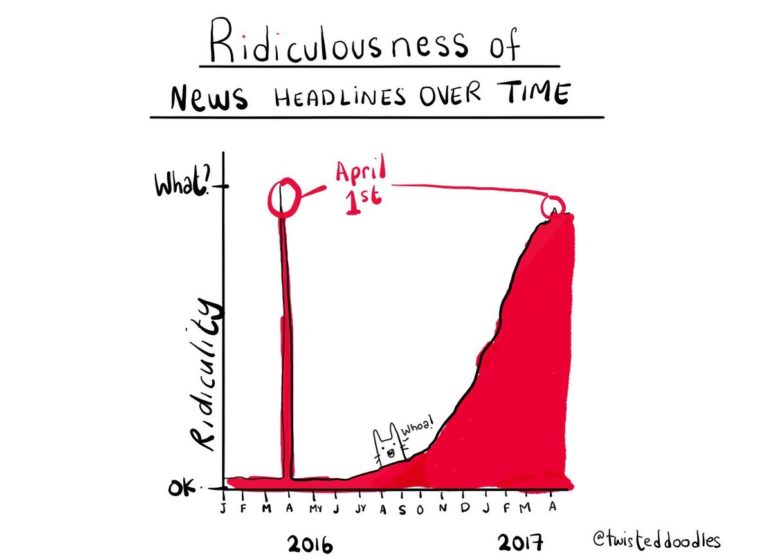
Here are the top data journalism tweets for Mar 27- Apr 2, per our NodeXL mapping: interactive graphics (@driven_by_data); ridiculous news (@twisteddoodles); Malofiej Infographics Awards (@malofiej); Germany’s radio masts (@stimmeonline); Republicans voting with Trump (@FiveThirtyEight); & more.

Data Journalism

Top Ten #ddj: The Week’s Most Popular Data Journalism Links

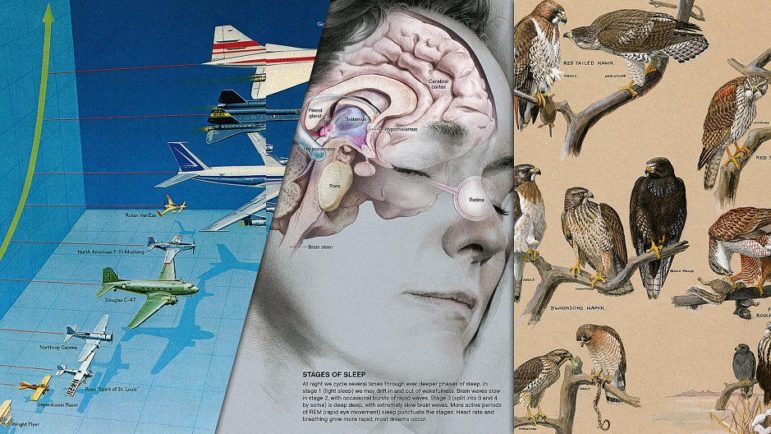
Here are the hottest data journalism tweets for Jan 23-29, per our NodeXL mapping: 100 Years of infographics (@NatGeoMag); Trump’s wall size (@thetruesize); Women’s March (@womensmarch); journocoding (@journocode); dataset viz 25 ways (@flowingdata); dataviz stocktake (@eagereyes); & more.

Data Journalism

Top Ten #ddj: The Week’s Most Popular Data Journalism Links

What are the hottest data journalism tweets? Here are top links for Dec. 12-18: An ode to bar charts (@stdbrouw); recommended data read (@albertocairo); CO2 emissions (@CarbonBrief); world tax & GDP data (@MaxCRoser); Twitter network graph (@was3210); French origins (@LeTelegramme); & more.

Data Journalism

Top Ten #ddj: The Week’s Most Popular Data Journalism Links

What’s the data-driven journalism crowd tweeting? Here are top links for Sept 19-25: brilliant info graphics (@visualoop); data state of mind (@MaryJoWebster); global temperatures visualized (@NASAEarth); African grants (@Sage_Of_Absurd); DDJ and investigative tools (@M_Mandalka); and more.