
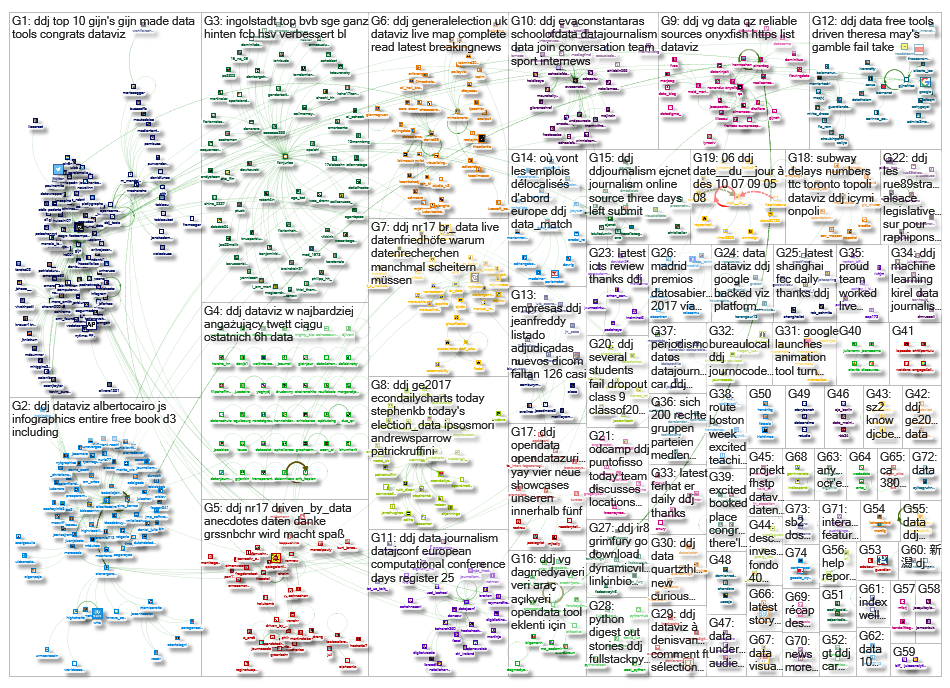
Top Ten #ddj: This Week’s Top Data Journalism


What’s the global #ddj community tweeting about? Our NodeXL mapping from June 5 to 11 includes #VisualTrumpery from @mcrosasb, analysis of Theresa May’s election disaster by @GuardianVisuals, dataviz structuring strategies from @eagereyes, and school enrollment woes in Delhi from @htTweets.
Lessons From #VisualTrumpery
Five takeaways from data expert Alberto Cairo’s recent #VisualTrumpery lecture in Barcelona on data journalists’ attitude towards teaching the audience to properly interpret graphs and visualizations.
5 takeaways on misleading data and #dataviz at #visualtrumpery event with @albertocairo https://t.co/CXBRZMMDhD #ddj pic.twitter.com/6f8nunlPnS
— Maria Crosas (@mcrosasb) June 11, 2017
DataViz Structuring Strategies
How should you sequence information in a data story so it makes the most sense? Are some sequences better than others? Robert Kosara, Jessica Hullman and Heidi Lam look at sequence and how people structure information in a presentation context.
This paper @eagereyes writes about sounds very interesting https://t.co/l0RxKigouG #dataviz #infographics #ddj pic.twitter.com/5unKbb7w7m
— Alberto Cairo (@albertocairo) June 5, 2017
How Theresa May’s Election Gamble Failed
Data visualization by The Guardian displays a few reasons for Theresa May’s election disaster: the Brexit effect did nothing for her, high turnout caught her off guard and Labour retained seats in deprived areas.
Great visual & data journalism by my @columbiajourn classmate @caelainnbarr on how & where Conservatives lost seats https://t.co/NHLMoiivEJ pic.twitter.com/KMEHYJ8NtA
— Olivia Crellin (@OliviaCrellin) June 9, 2017
Enrollment Difficulties in Delhi
The Hindustan Times illustrates why it’s so difficult to find a good government school in Delhi, including data on overcrowding, the lack of science streams in secondary schools and problematic transportation issues.
#ClassOf2018 | Plan to enroll your ward in a Delhi govt school? Here are the odds of getting into one@GurmanBhatia https://t.co/r8roZJWAH6
— Hindustan Times (@htTweets) June 8, 2017
French Parliamentary Elections
Find all the results of the first round of the 2017 French election in this interactive map by Rue89 Strasbourg.
Comme d’hab, une carte électorale d’#Alsace sur @Rue89Strasbourg ! https://t.co/X5lzmzVdVx #ddj #legislatives2017 pic.twitter.com/n2ZagSrUU6
— Raphaël da Silva (@Raphipons) June 12, 2017
French Jobs Relocate
From the archives: Jobs that disappear in France are sometimes reborn abroad. According to DataMatch, the relocation of these jobs mostly falls within Europe.
Où vont les emplois délocalisés? D’abord en Europe https://t.co/iB7FcZvmhj #ddj pic.twitter.com/yH2k1iS1ob
— DataMatch (@Data_Match) June 7, 2017
Exploratory Data Analysis in Python
Breakdown of Chloe Mawer and Jonathan Whitmore’s tutorial of exploratory data analysis during PyCon 2017, with an introduction to Jupyter Notebooks and exploratory analysis of several datasets.
Exploratory Data Analysis in Python: We summarize the objectives and contents of our PyCon… https://t.co/fHbB2kuI61 #BigData #Analytics pic.twitter.com/iZ2hYmvNyh
— Craig Brown, PhD (@craigbrownphd) June 8, 2017
Text Mining
Beautiful visualizations using Python of how language differs among document types by Jason Kessler.
Amazing tool for #texmining #datascience #ddj by @jasonkessler https://t.co/eAj7hiZDGA
— Momi Peralta (@momiperalta) June 11, 2017
European Data Conference
Three weeks left to the @datajconf in Dublin on July 6 and 7. Sign up now to join practitioners and academics in the fields of journalism and news production and information, data, social and computer sciences in multidisciplinary discussions.
25 days to the European Data & Computational Journalism Conference.
Register on https://t.co/KIrHZmnFpU.#ddj pic.twitter.com/qWmy37qfXQ— DataJ Conf (@datajconf) June 10, 2017
Flourish DataViz Platform
Data journalists and designers with an eye for storytelling and data design — but perhaps not the skills of a coder — will be able to build on Flourish’s basic templates easily and make their graphics more quickly.
This Google-Backed Data Viz Platform Was Designed For Non-Coders https://t.co/GRCiVgchjv #dataviz #ddj via @FastCoDesign pic.twitter.com/xs6KSUHy4y
— Stephanie Neal (@StephanieJNeal) June 6, 2017
Thanks, once again, to Marc Smith of Connected Action for gathering the links and graphing them.
For a look at Marc Smith’s mapping on #ddj on Twitter, check out this map.

This work is licensed under a Creative Commons Attribution-NoDerivatives 4.0 International License
Republish our articles for free, online or in print, under a Creative Commons license.
Republish this article
This work is licensed under a Creative Commons Attribution-NoDerivatives 4.0 International License
Read Next

Data Journalism
10 Outstanding Data Projects Win the 2024 Sigma Awards
There were 52 data journalism entries from 22 countries in shortlist for the 2024 Sigma Awards. Here are the top 10 winning projects.

Data Journalism Data Journalism Top 10
Trump’s Disappearing Donors, Tracking the Mars Rover, and the Ongoing Wars in Gaza and Ukraine
Our column of the best in data journalism also features stories on AI’s ability to forecast the weather, analyzing the Argentine president’s Tweetstorms, and apathetic EU voters.

Data Journalism
Updating the Inverted Pyramid of Data Journalism
Data journalist and instructor Paul Bradshaw has updated the Inverted Pyramid of Data Journalism — and brought together resources for every stage.
Data Journalism GIJC23 Reporting Tools & Tips
Tips to Guide Investigative Journalists in Document Text Analysis
Investigative journalists often face the challenge of reviewing and combining large documents or data in text forms. This can be very exhausting and labor intensive.