How Not To Be Wrong


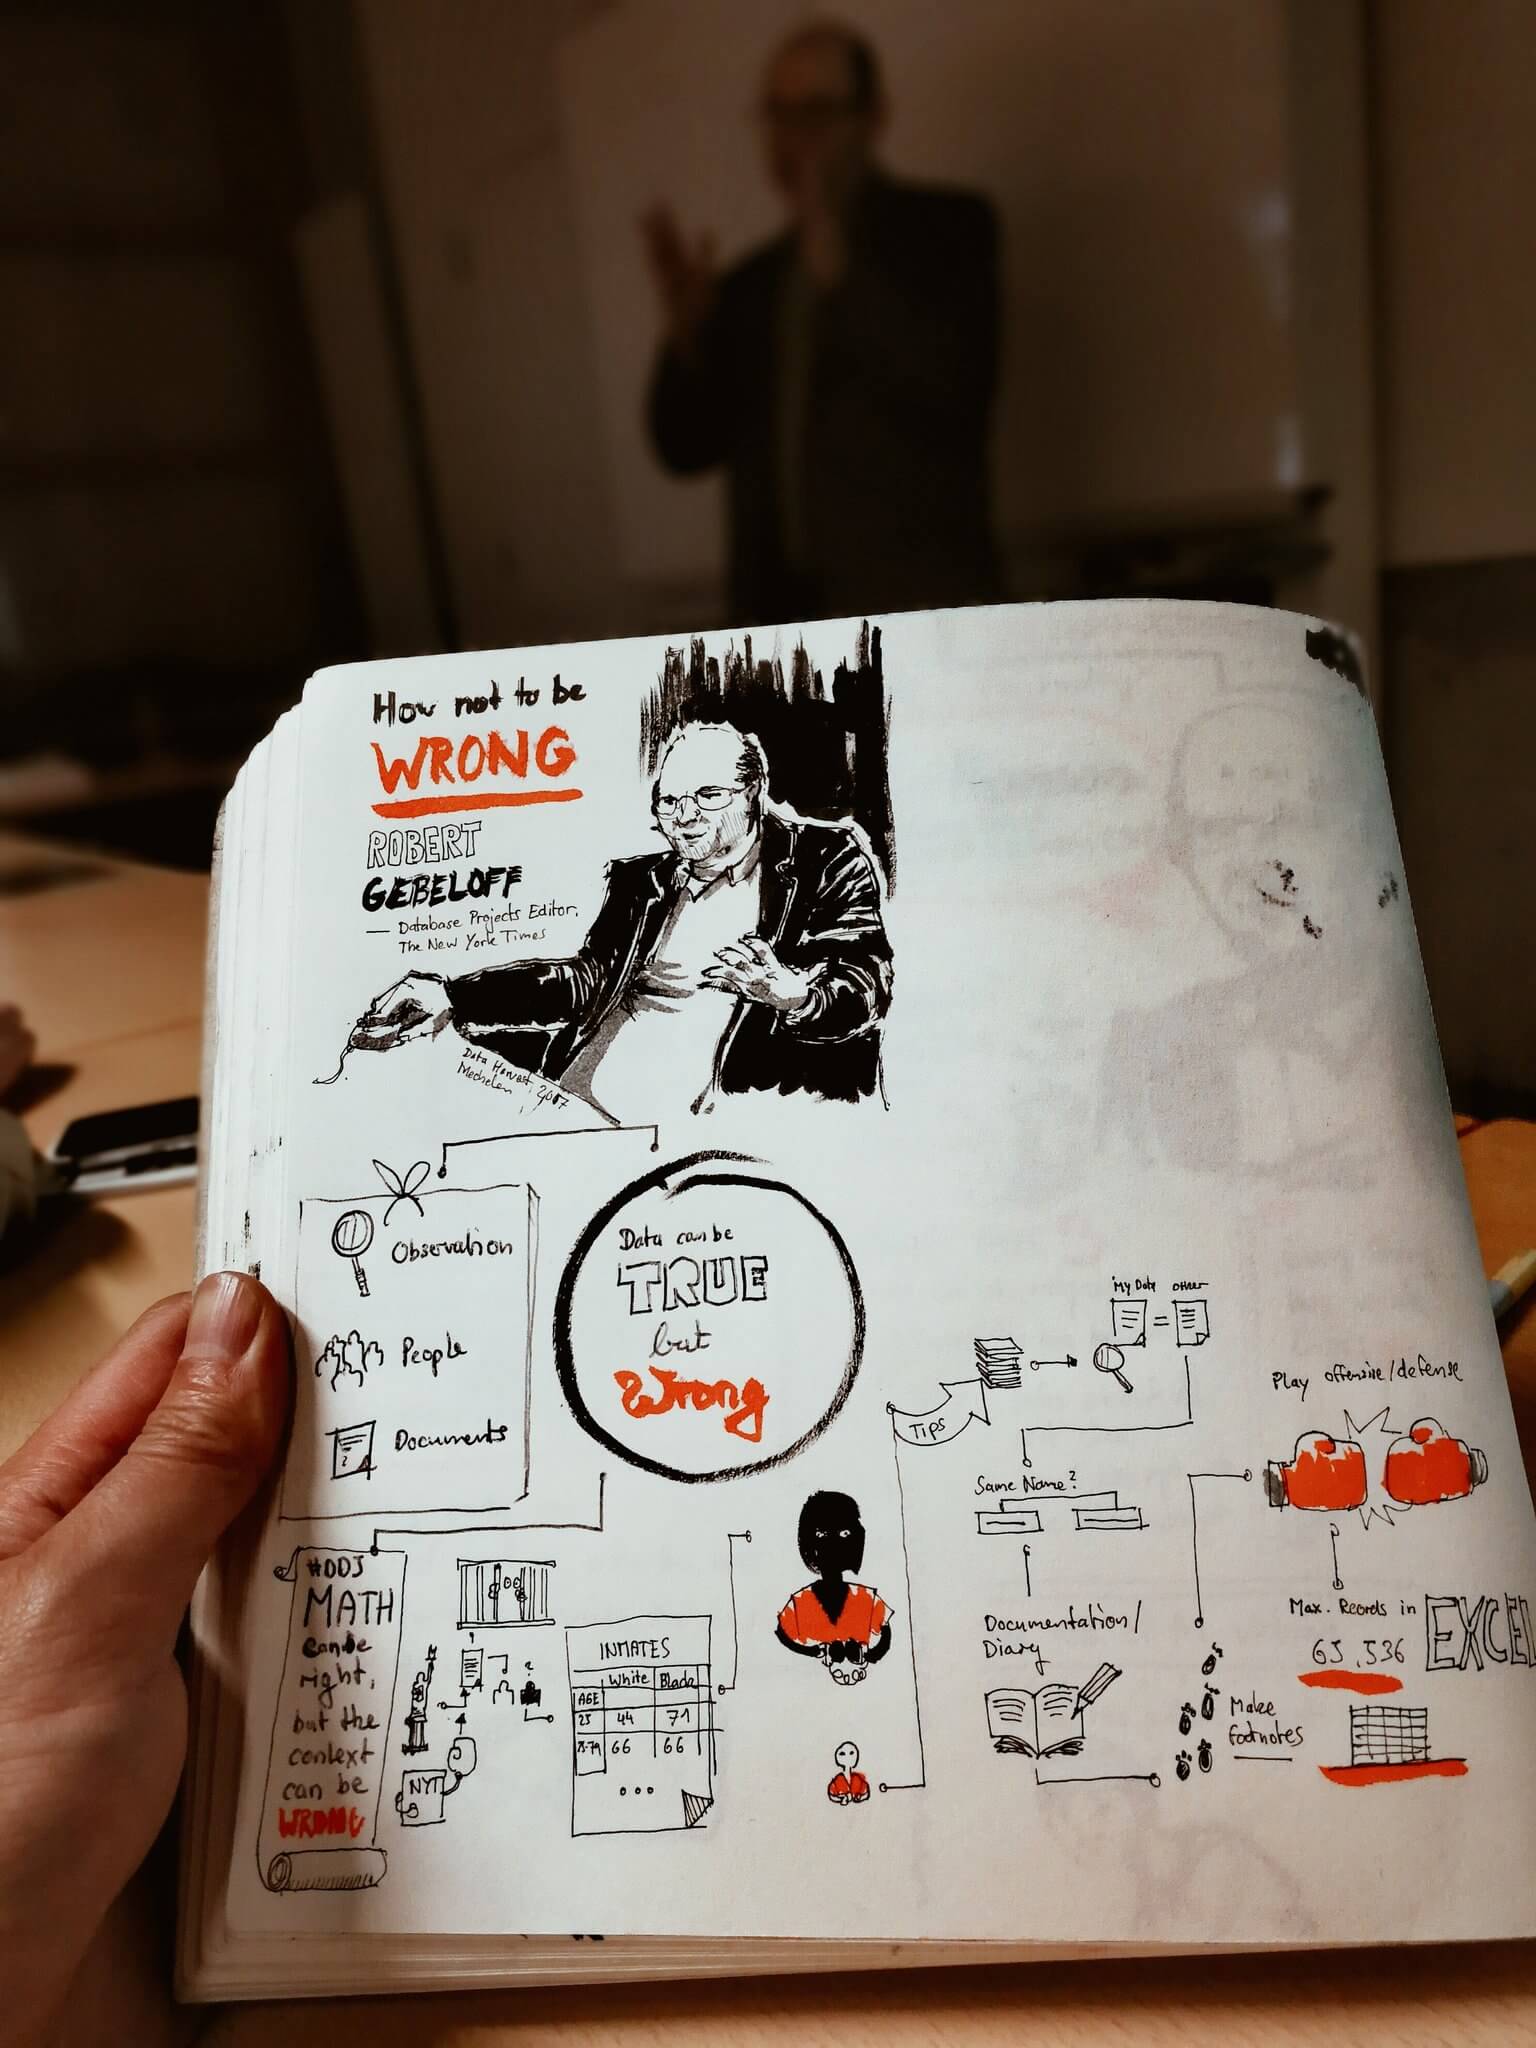
Noted: Sketchnote of Gebeloff’s talk by Phil Ninh.
At the intersection of data and journalism, lots can go wrong. Merely taking precautions might not be enough.
“It’s very well possible that your story is true but wrong,” New York Times data journalist Robert Gebeloff explained at the European Investigative Journalism Conference & Dataharvest, which was recently held in Mechelen, a city 20 minutes outside of Brussels.
“When I work on a big story, I want to know everything about the topic.” To make sure he doesn’t miss out, Gebeloff gets all the data sources he can, examines it in all relevant ways and publishes only what he believes to be true.
Half True Is False
But this approach is not totally foolproof.
“In data journalism, we cannot settle for ‘half-true.’ Anything short of true is wrong – and we cannot afford to be wrong.” Unlike fact-checking websites such as Politifact, which invented ‘scales’ for truthfulness, from false to true and everything in between, data journalism should always be true.
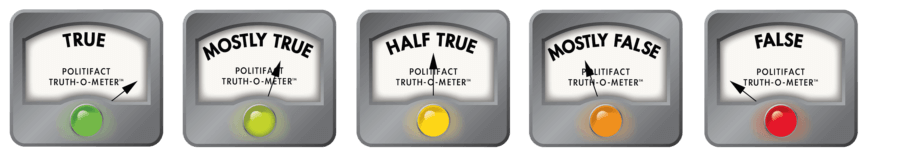
No Pants on Fire: Politifact’s Truth-O-Meter.
True but Wrong
But even when your story is true, Gebeloff said you still could still be wrong. “You can do the math correctly, but get the context wrong, fail to acknowledge uncertainties or not describe your findings correctly.”
Gebeloff mentioned a story on immigration judges appointed by George W. Bush who, under a political litmus test, were found to be far more likely to reject asylum seekers. The original premise was based on the fact that 11 of the judges refused asylum at a higher rate than their peers. While this thesis seemed true, it was also wrong, according to Gebeloff.
“I thought we had to ditch the 11 of 16 being above average as our best number. Two of the 11 had differences that were not statistically significant, so we should not portray them as above average.” To calculate statistical significance you can use a chi-square formula, which accounts for the difference, but also for sample size. “Because our premise was based on a small sample size that was accounted for, it was true but wrong.”
Fancy Math
When working on a story, journalists should consider whether they use “fancy math” – think statistics – or “standard math.” “Using fancy math you can explore complex relationships, but at the same time your story will be harder to explain.”
Using fancy math might be necessary to find or report a story. But if you cannot explain what you’ve done to your readers, your audience will probably be skeptical. “Sometimes I don’t do a story because I could never explain the methods I’d need to my audience.”
Targets as a Source
In part II of The New York Times series “Race Behind Bars,” Gebeloff and colleagues questioned racial bias methodically, using data. Since haters gonna hate, they did the calculations every way they could think of. It shows in this paragraph:
In most prisons, blacks and Latinos were disciplined at higher rates than whites – in some cases twice as often, the analysis found. They were also sent to solitary confinement more frequently and for longer durations.

Doing it with Data: Screenshot of The New York Times “Race Behind Bars” series, which ran in December 2016.
To make sure you’re not going to be wrong, you should share your findings. “Don’t just share findings with experts, share them with hostile experts too,” Gebeloff advises. “Use your targets as a source. If there’s a blowback, you want to know before publication – and include the blowback in the publication.”
How Not To Be Wrong Checklist
Here’s why you want to use this checklist, which is based on Gebeloff’s presentation: a half truth is false, and data journalism should always be true. But just being true is not enough. Your story can be mathematically true but wrong in context or explanation. You should want your stories to be true and not wrong.
 Check your data carefully:
- Pay attention to dates.
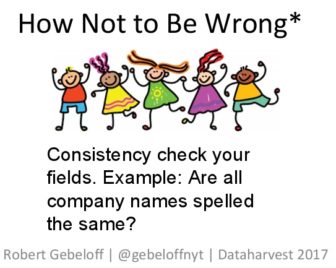
- Check for spelling and duplicates.
- Identify outliers.
- Statistical significance alone is not news.
- Prevent base year abuse: if something is a trend, it should be true in general not just if you cherrypick a base year.
- Make sure your data represents reality.
- As you work, keep a data diary that records what you’ve done and how you’ve done it. You should be able to reproduce your calculations.
- Make sure you explain the methods you used – your audience should be able to understand how you find a story.
- Play offense and defense simultaneously. Go for the maximum possible story, but at all times think of why you might be wrong, or what your target would say in response.
- Use your targets as a source to find blowbacks before publication.
- As part of the proofing process, create a footnotes file. Identify each fact and give it a number. Then, for each fact, list which document it came from, how you know it and the proof. Fix what needs to be fixed.

Additional links of interest: the slides of Robert Gebeloff’s how not to be wrong presentation, and the methodology notes and data from the “Race Behind Bars” series.
This post first appeared on Winny de Jong’s datajournalistiek.nl blog and is reproduced here with permission.
 Winny de Jong is a freelance data journalist and trainer. Previously she was employed as a data journalist at the Dutch magazine OneWorld. Winny has spoken and trained for organizations like TEDx, the European Journalism Center, the Dataharvest conference and several journalism colleges.

This work is licensed under a Creative Commons Attribution-NoDerivatives 4.0 International License
Republish our articles for free, online or in print, under a Creative Commons license.
Republish this article
This work is licensed under a Creative Commons Attribution-NoDerivatives 4.0 International License
Read Next

Data Journalism
10 Outstanding Data Projects Win the 2024 Sigma Awards
There were 52 data journalism entries from 22 countries in shortlist for the 2024 Sigma Awards. Here are the top 10 winning projects.

Tipsheet Data Journalism Reporting Tools & Tips
Tipsheet for Using Ocean Data in Your Investigations
Investigations into what happens on, under, and around the ocean can often be answered thanks to the vast amount of data available online.

Data Journalism Reporting Tools & Tips
Best Practices for Working With Mass Shootings Data
There can be confusion among journalists about “mass shootings” data, which leads to wildly different numbers and deeper confusion among audiences.

Data Journalism Data Journalism Top 10
Trump’s Disappearing Donors, Tracking the Mars Rover, and the Ongoing Wars in Gaza and Ukraine
Our column of the best in data journalism also features stories on AI’s ability to forecast the weather, analyzing the Argentine president’s Tweetstorms, and apathetic EU voters.