
Top Ten #ddj: The Week’s Most Popular Data Journalism Links
 What’s the data-driven journalism crowd tweeting? Here are top links for Nov 7-13: guide to be a data journalist (@willems_karlijn); infobeautyaward winners (@ddjournalism); bulletproofing data course (@ejcnet); data pitfalls (@journalismnews); EU & US economic data (@github); & more.
<!–
–>

Tipsheet: Latest Tools for Investigating with Telegram

Investigating Elections: Threat from AI Audio Deepfakes

Updated GIJN Databases (Poverty, Crime, Corruption, and Terrorism)

Updated Resources on Corruption

Data Journalism Top 10: Scented Candles, COVID Risk Simulator, Trump’s Final Regs, Sigma Awards
Data Journalism Top 10: Visualizing Hurricanes, Predicting Wildfires, Social Media Algorithms, Trump Loyalty Index
Data Journalism Top 10: Black Voter Suppression, K-Pop, Data Privacy Rights, and Global Coronavirus Deaths
Data Journalism Top 10: Herd Immunity Calculator, Post-COVID Offices, Back-to-School Jitters

This work is licensed under a Creative Commons Attribution-NoDerivatives 4.0 International License
Republish our articles for free, online or in print, under a Creative Commons license.
Republish this article
This work is licensed under a Creative Commons Attribution-NoDerivatives 4.0 International License
Read Next
Data Journalism
Data Journalism Top 10: Scented Candles, COVID Risk Simulator, Trump’s Final Regs, Sigma Awards
Are scented candles a casualty of the coronavirus crisis? Our NodeXL #ddj mapping from November 23 to 29 found researcher Kate Petrova’s data analysis revealing that scented candles have suffered a blow in online reviews and a decrease in ratings, possibly linked to the coronavirus’ ability to affect people’s sense of smell. Elsewhere, Germany’s Zeit Online created a COVID-19 infection risk calculator, the COVID Tracking Project explained how holidays and weekends disrupt the recording and publishing of virus data, and Reuters analyzed the shortcomings of the coronavirus contact tracing system in England. Meanwhile, the Sigma Awards, which celebrate the world’s best data journalism, have opened for entries.
Data Journalism
Data Journalism Top 10: Visualizing Hurricanes, Predicting Wildfires, Social Media Algorithms, Trump Loyalty Index
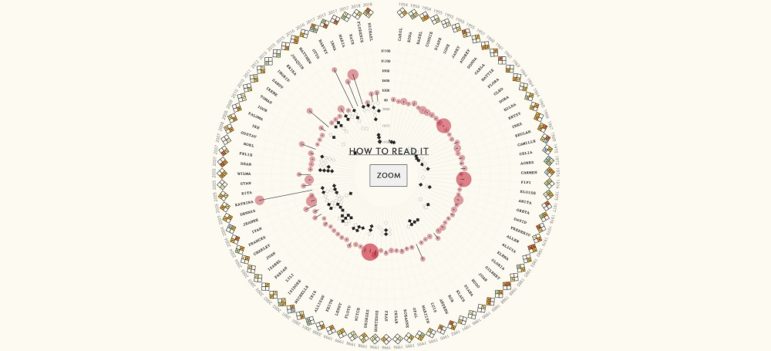
How does climate change increase the likelihood of weather extremes? Our NodeXL #ddj mapping from October 12 to 18 finds ProPublica examining how the warming global climate exacerbates wildfire activity, and designer Will Chase visualizing some of the most destructive hurricanes with an interactive wheel graphic. The Financial Times is summarizing key trends of the pandemic using charts, maps, and graphics, while The Markup announced its latest project looking into the black box algorithms of social media platforms.
Data Journalism
Data Journalism Top 10: Black Voter Suppression, K-Pop, Data Privacy Rights, and Global Coronavirus Deaths
Personal data is big business, and not only for private firms. Our NodeXL #ddj mapping from September 21 to 27 finds a number of troubling investigations: Channel 4 News revealed that Donald Trump’s 2016 presidential campaign used personal data from Facebook and Cambridge Analytica to deter Black voters from casting their ballot; Consumer Reports found that companies were making it difficult for people to opt out of having their data sold despite a landmark California law that protects individual data rights; and Noteworthy and The Business Post highlighted a concerning lack of clear regulation surrounding access to, and use of, genetic and patient data by private firms.
Data Journalism
Data Journalism Top 10: Herd Immunity Calculator, Post-COVID Offices, Back-to-School Jitters
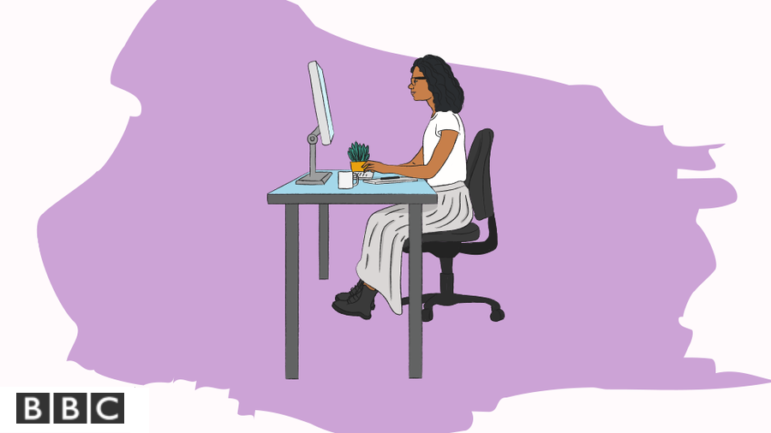
How many people need to get infected or die of the coronavirus before we reach a herd immunity threshold? Our NodeXL #ddj mapping from August 3 to 9 finds that The Washington Post created a herd immunity calculator to estimate this. Also in the Data Journalism Top 10 this week: BBC’s Visual and Data Journalism team illustrates the future of work environments post-COVID-19, The New York Times shares projections of the potential number of children who may carry the virus back to school in the fall according to county, and Oregon Public Broadcasting discovers a surprising reason for the low incidence of coronavirus transmission in bars and restaurants in the US state of Oregon.